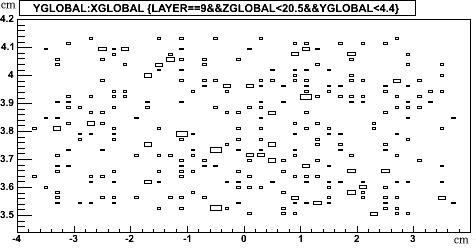
sili_endcap_zldrd = 20.50, 25.83, 31.06, 36.30 cm.
Number of 8-chip modules: 12, 20, 20, 20
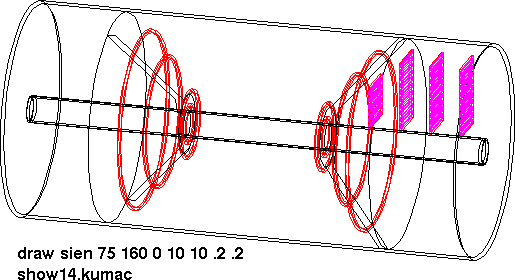
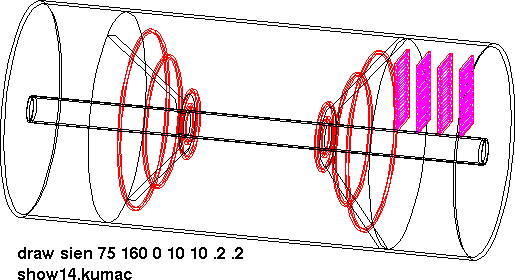
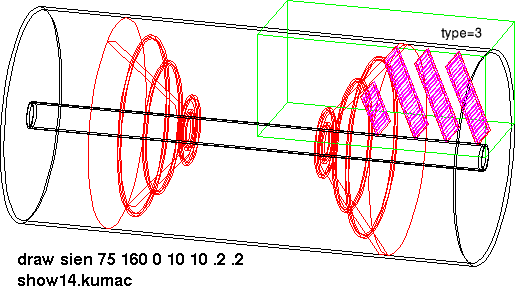
Although not shown in this view, the model contains the beam pipe, the central barrels (carbon supports, silicon and cooling tubes), carbon support cage and cables, and in the endcap region 3mm carbon panels supporting the 8-chip modules made of 300µm silicon.
5. 5.0 18.0 90.0 14.0 100 0.0 0.0 0.0 0.0
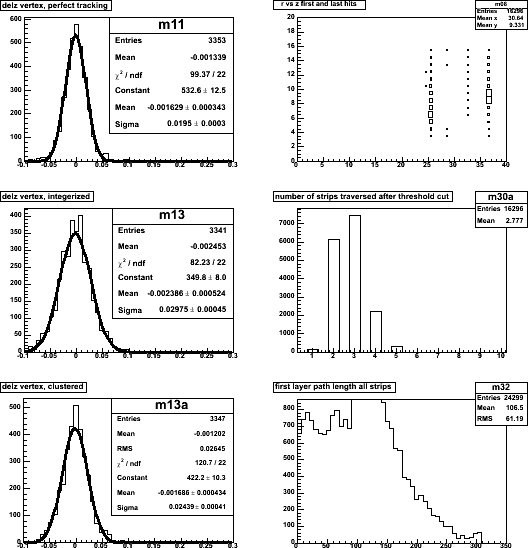
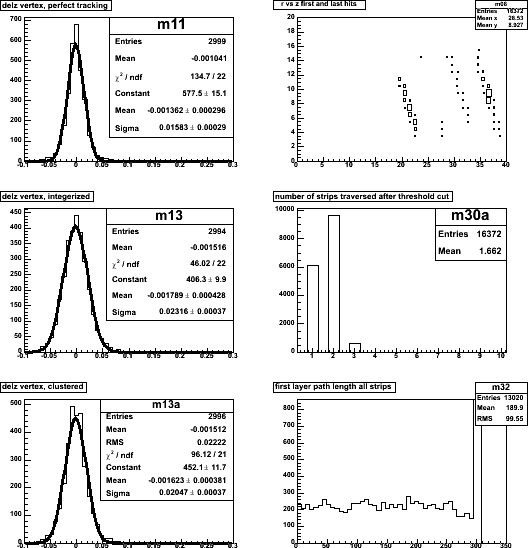
(this is 5 Gev muons sprayed into the North arm) ancsvx_type4_01.root, analyzed with resolution_both.C, and plotted with res_cluster_both.C
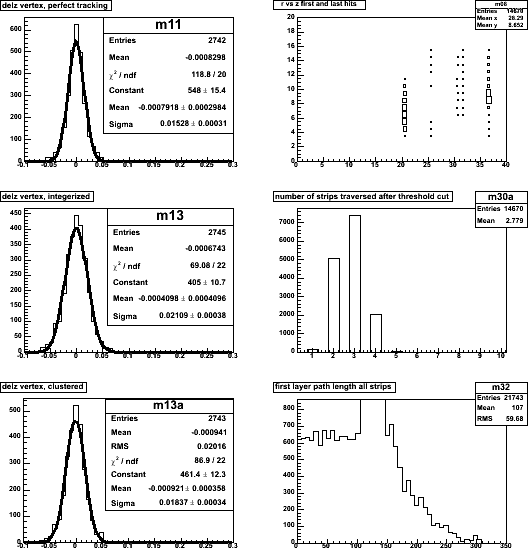
Type 4 z-vertex resolution = 184 µm
- Top left: z-vertex distribution using straight-line fits to the pisa
hits directly. The
smearing is due only to multiple scattering.
- Top right: only tracks that hit 3 or 4 planes are used, and this is a
side view where the first and last hits on a track are shown. The >=3
requirement causes the 'holes' in planes 2 and 3.
- Middle left: z-vertex when you move the pisa hit to the center of a
50-µm strip. Doing this loses you some resolution
- Middle right: cluster size distribution
- Bottom left: z-vertex when you use the geometric center of the cluster
(no pulse height information used). This recovers some of the resolution
lost when only the center of one strip was used. Even more can be gained
if the pulse heights are also used in a weighted mean.
- Bottom right: path length through the strip, which is a surrogate (modulo Landau fluctuations) for the ADC value in a strip.
→ PISAEvent_type4_29sep06.root
→ ancsvx_type4_29sep06.root
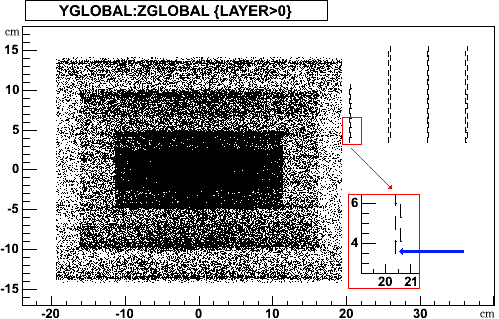
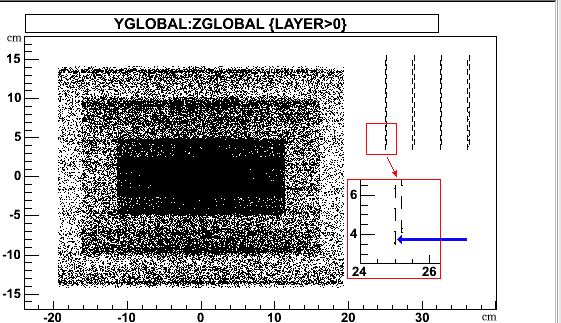
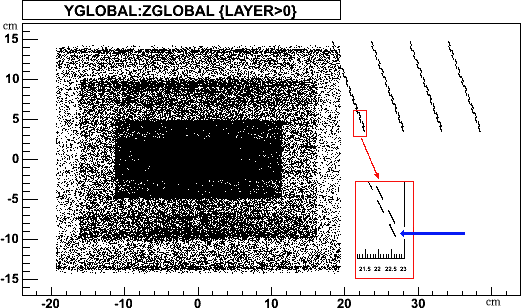
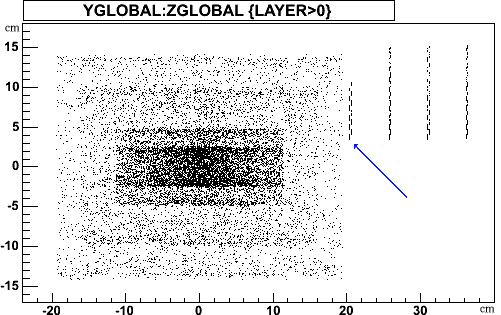
I ran 11 central AuAu Pythia events. This plot shows the hits in a side view of the silicon detector. You can see the barrels, and the 4 endcap layers, with 8-chip modules placed on the front and back of an (invisible) support structure. The inset shows the bottom of the first station, and the blue arrow points at the lowest 8-chip module.
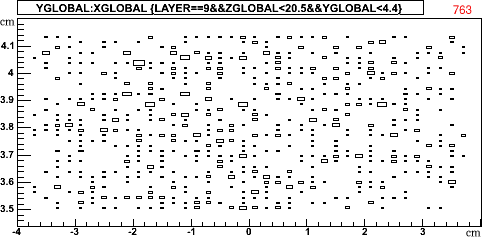
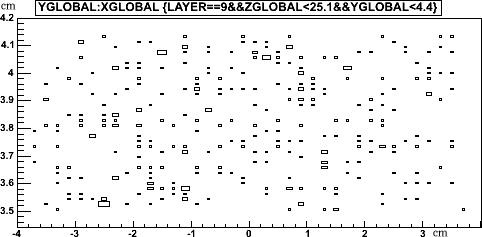
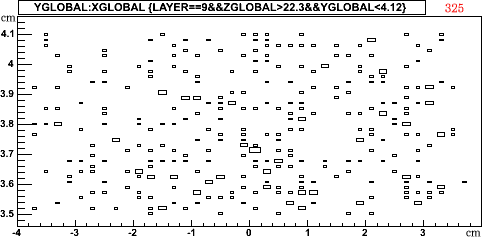
Taking the active area of a single chip (≅0.6×0.8 cm), 28xx pixels per chip, and a mean number of pixels per track of 2.78 (see picture above) gives 8.0 pixels on per central AuAu collision, for the busiest module in the detector.
The averages for the whole first plane (12 8-chip modules) are a factor of 2.25 less, or 3.6 pixels on per chip per central collision.
sili_endcap_zldrd = 25.10, 28.83, 32.56, 36.30 cm
Number of 8-chip modules: 20, 20, 20, 20
The average for the whole 20-module first plane is down by a factor 3.24.
[This is the same number as for the type-4 configuration, even though the distance to the vertex is larger. The reason is that the track density goes up as the track angle goes down: the track density in the 2nd plane of the type-4 detector is 5.7±0.3 per event per cm², which is statistically the same.]
sili_endcap_zldrd = 25.10, 28.83, 32.56, 36.30 cm
Number of 8-chip modules: 12, 20, 20, 20
The average for the whole 12-module first plane is down by a factor 2.27.
PISAEVENT_auauminbi.root, and ancsvx_auauminbi.root, from pythia file /phenix/data11/rhphemds/run2/hijing/ hji135evt_20000auauminb200sq01_060602.dat
I ran 11 minbi AuAu Pythia events. This shows the hits in a side view of the silicon detector. You can see the barrels, and the 4 endcap layers, with 8-chip modules placed on the front and back of an (invisible) support structure. The inset shows the bottom of the first station, and the blue arrow points at the lowest 8-chip module.
The average for the whole 12-module first plane is down by a factor 2.09 from that of the busiest module, for these minbias events.