 planes used RMS  sigma
------------------------
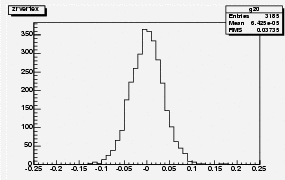
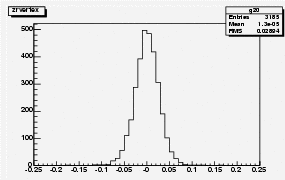
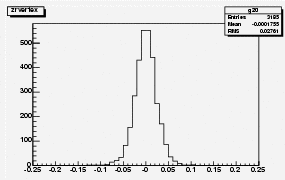
  1 and 2   373   361 um
  1 and 3   289   265
  1 and 4   276   237
------------------------
Looks like extra lever-arm outweighs multiple scattering for this set of tracks.
 g20_p12.ps
 g20_p13.ps
 g20_p14.ps
On the right is the z-r vertex position, when extrapolated using
silicon planes 1 and 2, 1 and 3, and 1 and 4, respectively.
planes used RMS sigma ------------------------ 1 and 2 373 361 um 1 and 3 289 265 1 and 4 276 237 ------------------------Looks like extra lever-arm outweighs multiple scattering for this set of tracks. |  g20_p12.ps g20_p12.ps
|
 g20_p13.ps g20_p13.ps
| |
 g20_p14.ps g20_p14.ps
|
| r-z resolution with gaussian fit, and the vertex
distribution folded with this resolution.
pz of the muons >2.5 GeV | 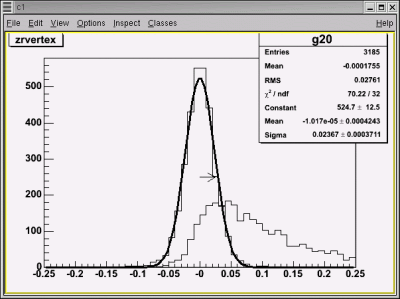
|
| fig 9 from proposal | 
|
| pt of muons with pz>2.5 GeV going into the North muon arm | 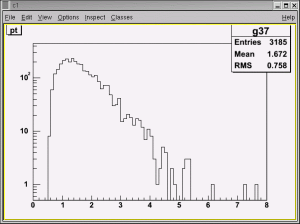
|
| Next I increased the thickness of the silicon to 1mm, to represent the
expected total thickness of Si, readout, support and cooling.
Also slight adjustments of the 'integerization' to account for the tilted lampshade planes. New version of the macro: beauty03.C | 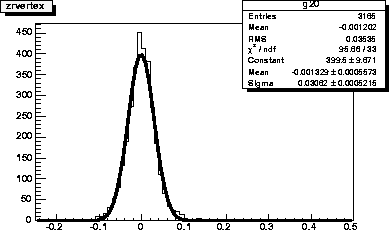 ps
ps
|
| ... same with planes 1 and 3. Almost no difference now. | 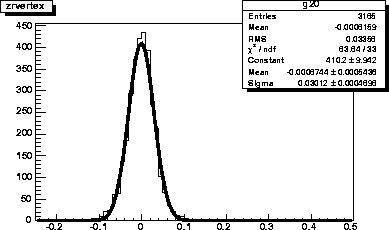 ps
ps
|
|
This is an overlay of the charm->mu and B->mu, scaled such that the horizontal and vertical scales are the same, and normalised so that the maxima are the same. Clearly charm falls off much faster. An eyeball fit to straight-line slopes shows htat B gains a factor 10 on charm for every 1.4 GeV in pT | 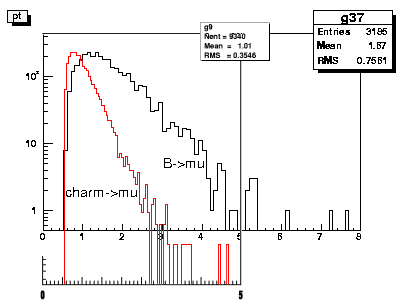
|
| B->mu decay lengths from pythia are plotted in black.
Charm decays to mu have a mean decay length of 0.785 mm, represented by the
red line, which means that muon rates from B gain an order of magnitude over
mu from charm for every 5.7mm
The non-exponential tail suggests that if you cut at z>5mm, you would gain even faster. Note the z-vertex resolution is 0.31 mm | 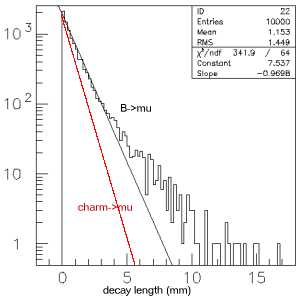 ps
ps
|
From Pythia output: acceptance is 3185 surviving events, from 10k, which took 188k tries, into the North end only -> 0.034; Charm numbers are from Joel and Pat's old charm studies, and the PDG , we have:
| Cross section | Acceptance | BR | total rel. rate | |
|---|---|---|---|---|
| charm | 650 ub | 0.0091 | 5.9 | |
| beauty | 1.46 ub | 0.034 | 10.49% | 0.0052 |
So mu's from B are down by a factor 1135 relative to mu's from charm. This
allows us to fix the relative normalization of the pT plots for c, and b:
pT distributions, properly normalized. Eyeball fits (in green) cross over at about pt=4.4 GeV. At this pT, 0.5% of the mu's from B decays survive the pT cut. | 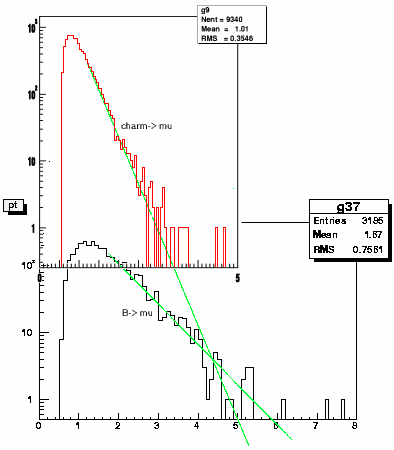
|
| x1 vs pz for c->single mu, run 53
root macro | 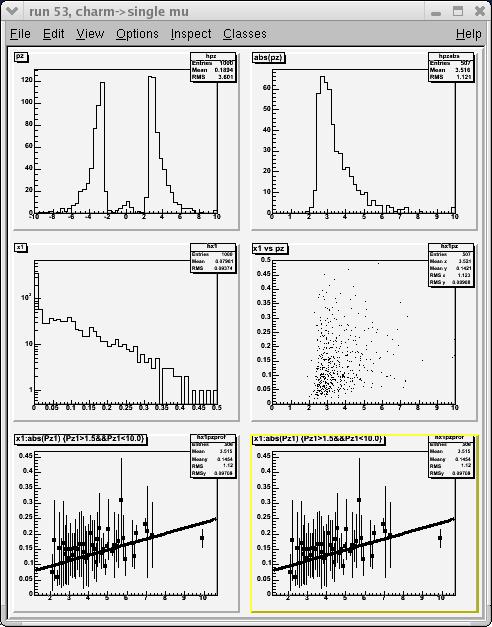
|
| x1 vs pz for b,bbar->single mu (run41, same as 27)
root macro | 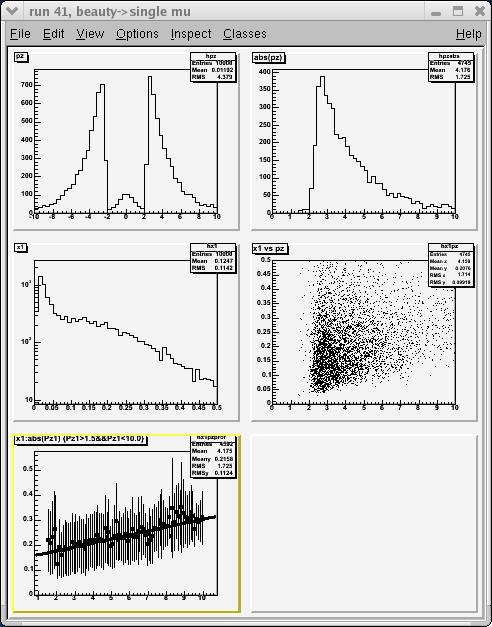
|
| x2 vs pt for b,bbar->single mu (run41, same as 27)
root macro | 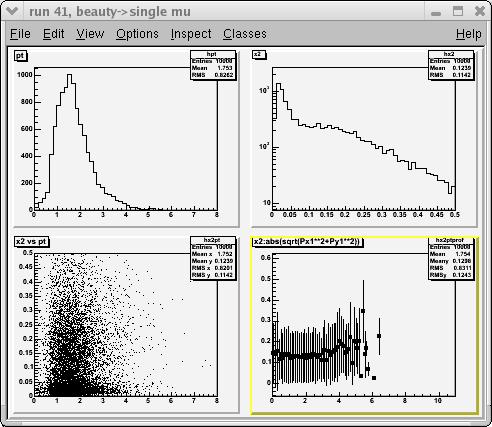
|
| x2 vs pt for c,cbar->single mu (run53)
root macro | 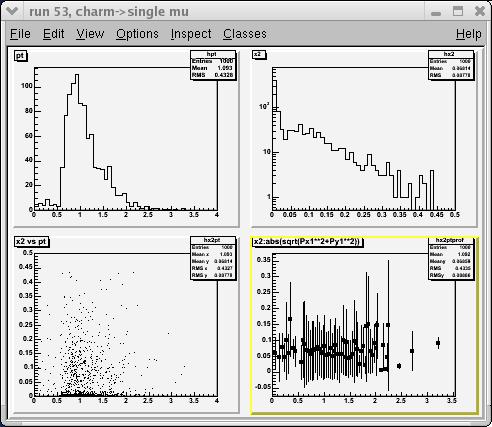
|
| Raw spectrum c, cbar->single muon, 1M events. Lines are eyeball fits, to compare with the low-stat plot before. In that plot, 6 orders of magnitude below the peak is at the 0.8 event level, which is at abou 5.0 GeV pT. In this new plot, 6 orders down is reached for pT=5.8 GeV/c. | 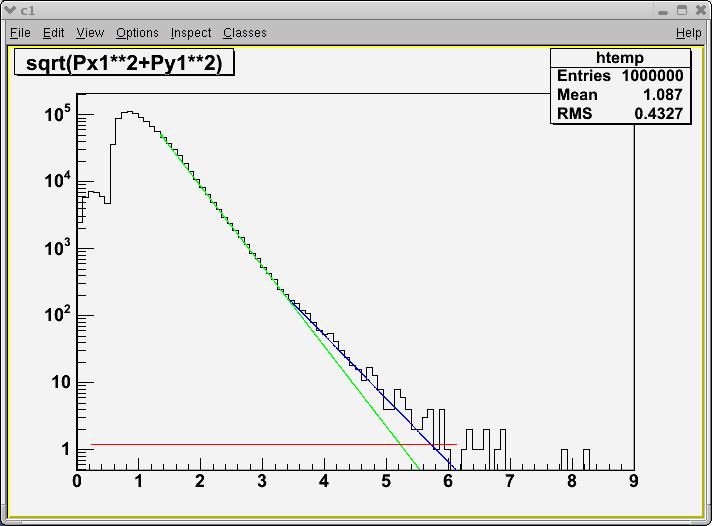
|
| c,cbar->single muons. Using only hits on planes 8 and 12 (North endcap) to extrapolate to the z-axis. this is the vertex z position distribution (cm) | 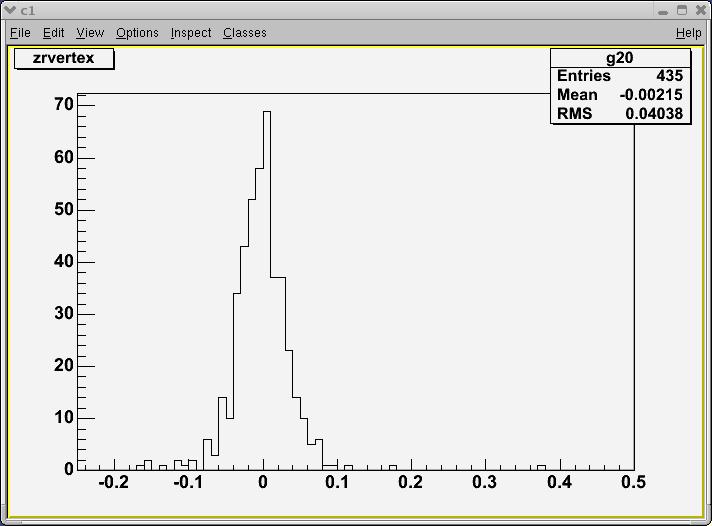
|
| same distribution for b,bbar->single muon | 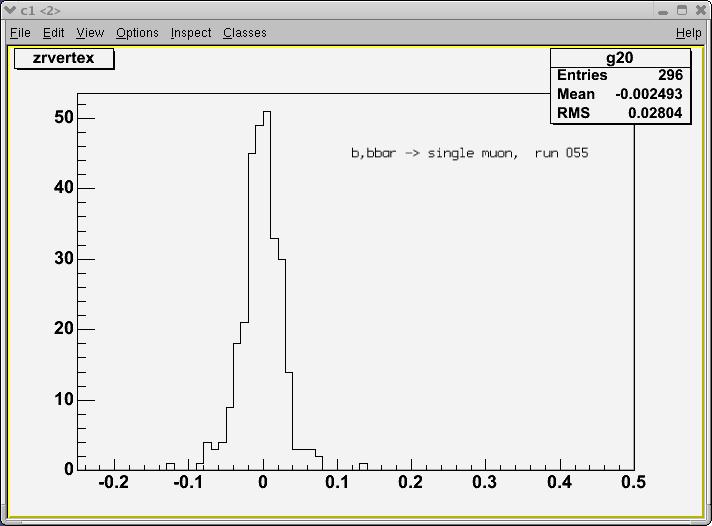
|