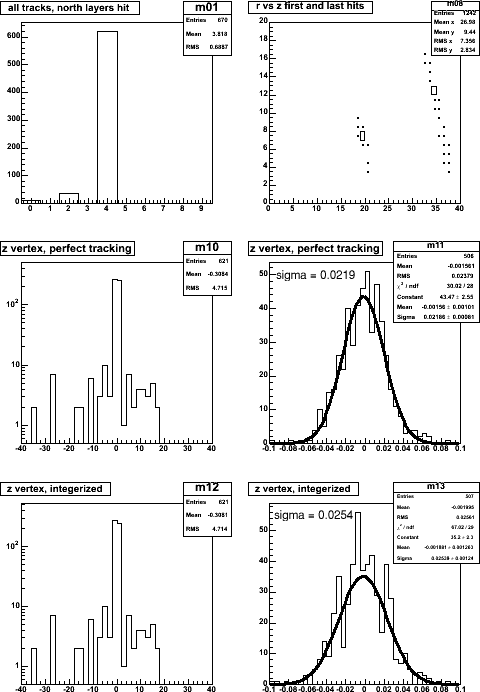
n = 769
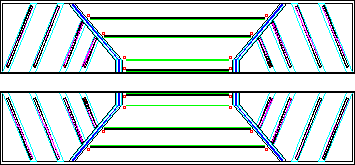
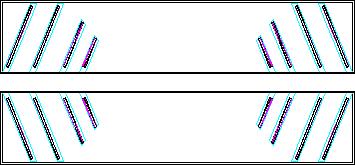
Right: first, last plane hit radiogram.
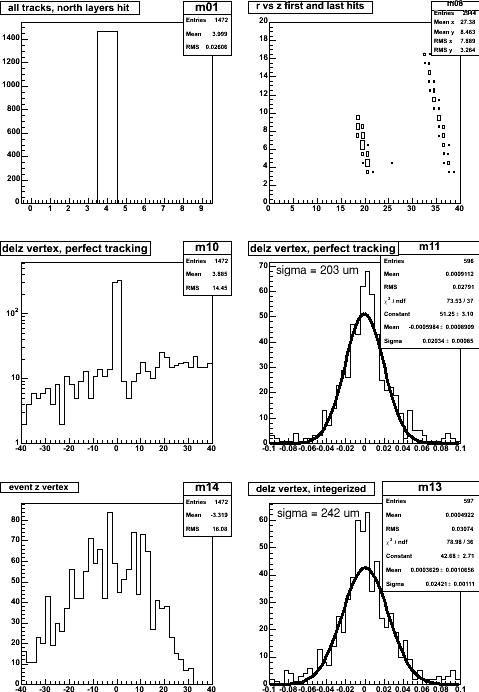
n = 1324
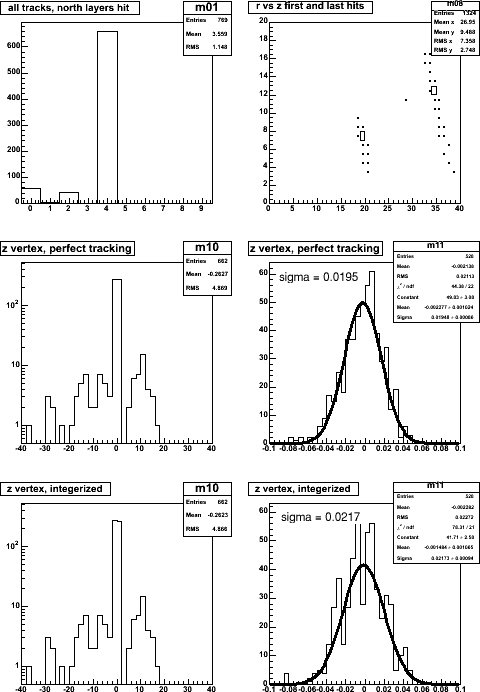
Left: intercept on large scale. Why are there entries in the non-zero bins?
(scales are in cm).
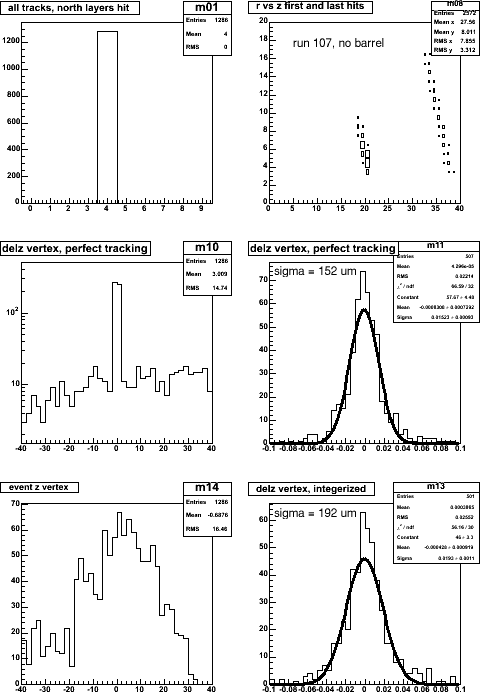
n = 662
Right: zero-bin expanded. Only xxx entries. Sigma 195 um.
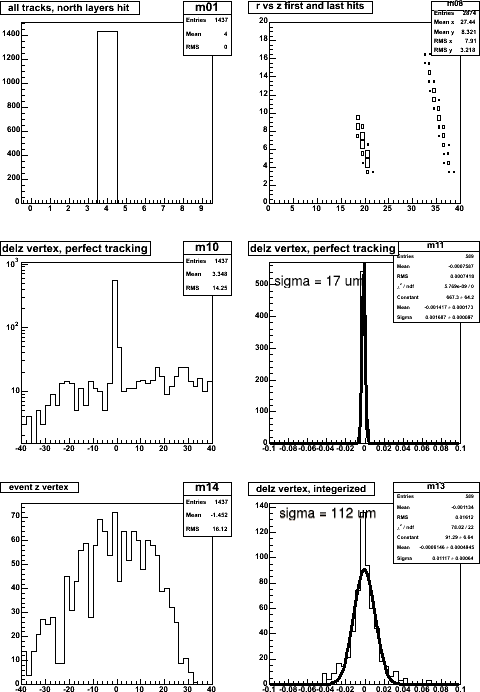
n = 528
n = 662
n = 528