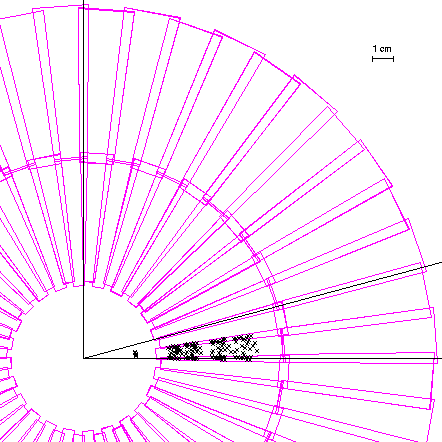
| This shows silicon in Pisa. Note z is down the beampipe, so y is up
and x is to the right. Since there is 24-fold symmetry, this does not really
matter. We will be looking for the overlaps.
I threw 25 tracks, and plotted hits.
(cfmgmc = 5. 5.0 12.0 3.75 1.0 25 0.0 0.0 0.0 0.0)
You can see 4 blobs of hits corresponding to endcaps 9, 10, 11 and 12.
You can see double the density in the overlap regions. A few tracks
hit barrel layer 1 also.
overlap.kumac
| 
|
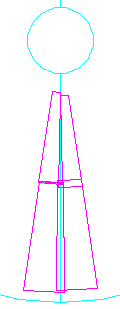
| Modify svx.f such that only one wedge is installed Pink is silicon.
(activate switch
ltest). Note wedge #1 point to -y. (same picture
with chips etc.)
On the right is the PISA output, showing hits in the whole plane, and hits
from all 24 wedges superimposed (of course no difference if only one
wedge is installed).
| 
|
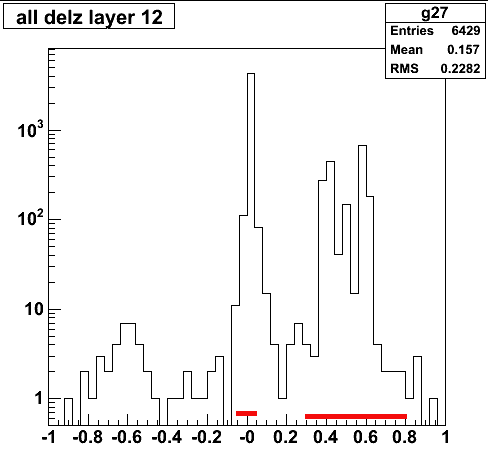
| Records in the Pisa output files have Event, Track, Layer (=shade)
This is the distribution of (global) delz for those records that have the same
event, track and layer number as the previous record. Delz is global z minus
global z of the previous record. Thus they include hits in
areas where silicon panels overlap (delz=0.3-0.8cm).
Note the log scale and the fact that most entries are for delz~=0.
| 
|
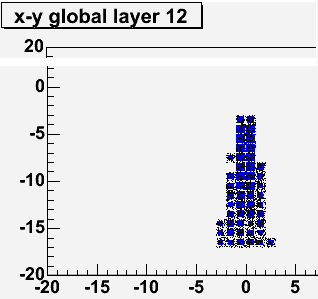
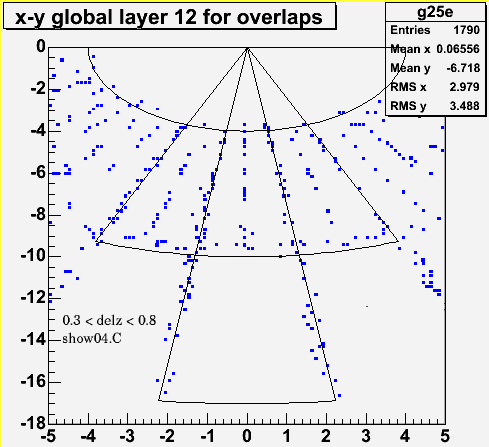
| Hits in global x,y in layer 12 (last shade), for delz=0.3-0.8.
Indicated are the panel boundaries. You can see overlap hits along the panel boundaries
from r=4-17 cm, as well as the overlap at about r=10cm between inner radius and
outer radius silicon.
Overlap of inner Si in along the vertical can be seen, but no overlaps for the outer
Si.
| 
|
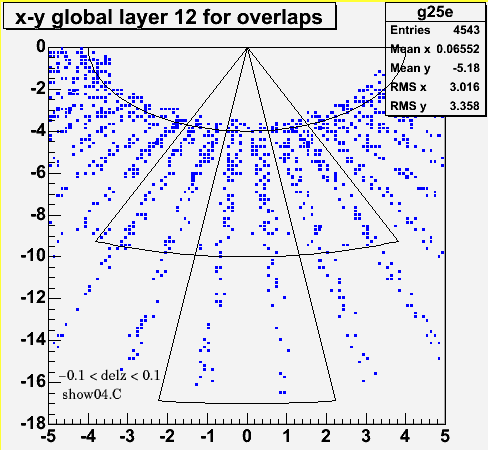
| same, but for |delz|<0.1
| 
|
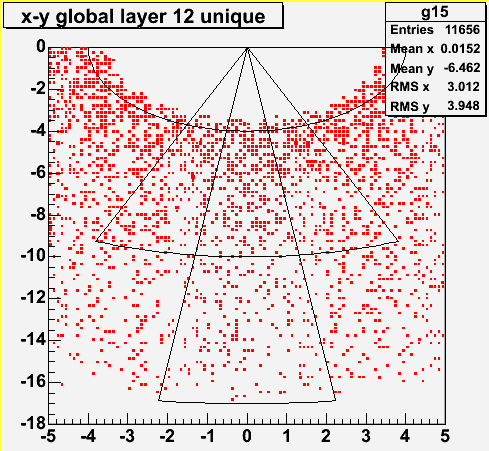
| Unique hits (event, track, layer different from previous record)
| 
|
| Unique hits for layer 8 (closest to the IP), binned in cm2
Peaks at ~70 for 10 events, 7/event.
|
|
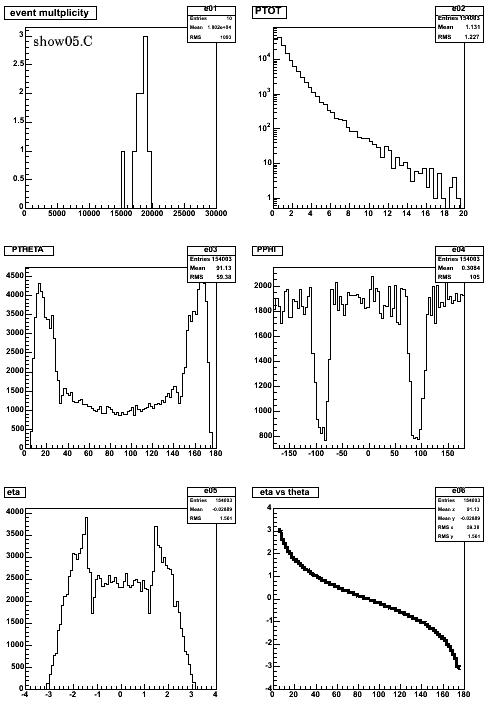
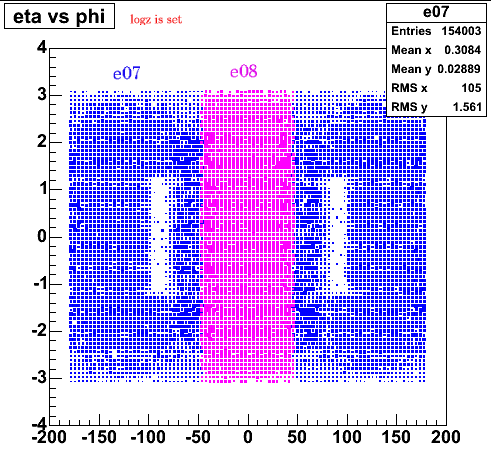
| Plots for all unique records. You can see the boundaries between the barrel and
endcaps.
Gaps in PPHI show areas in phi where the barrel has no coverage.
| 
|
| This shows the holes in the coverage. The pink slice is 90° in φ,
full eta. This should show a smooth dn/dη
| 
|
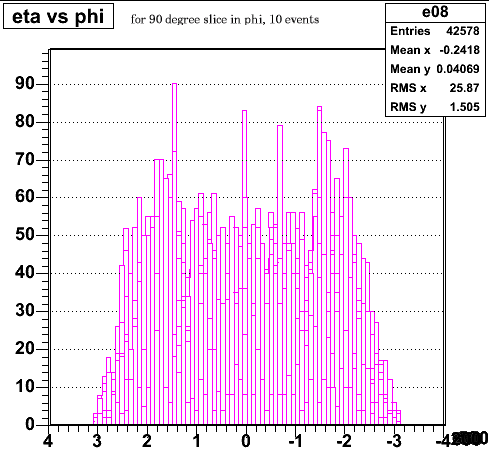
| 90-degree sector seen edge-on. Why does this not show the expected
dn/deta shape?
| 
|
Next: 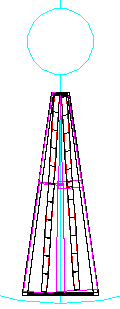