| I made special versions of svx.f and svx_fvtx.f to turn components
off. Here, I only turned on the support disk for North station 2 (=layer 10).
|
|
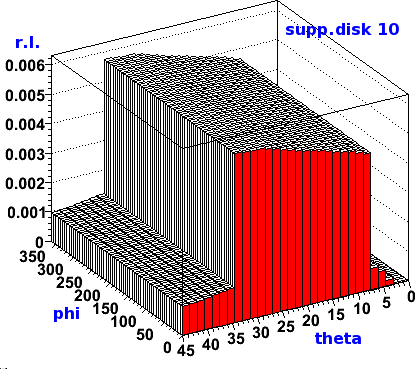
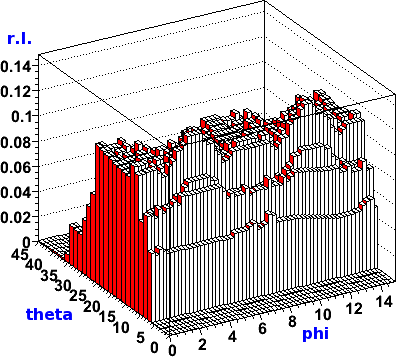
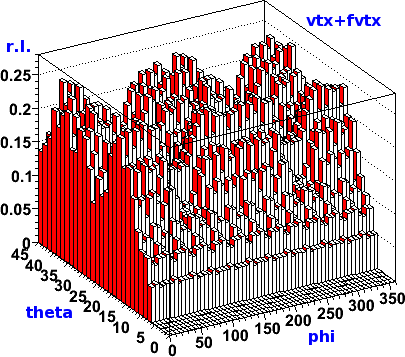
| This is the r.l. plotted between θ=0°-45°,
and over all φ. The rise from 8° to 35° is due to the increasing
angle of incidence of rays coming from (0,0,0).
The 'foot' is due to the
air inside the VTX/FVTX enclosure, see below.
| 
|
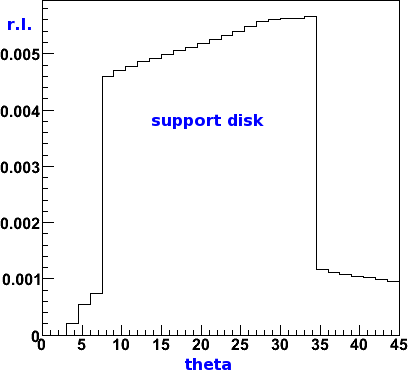
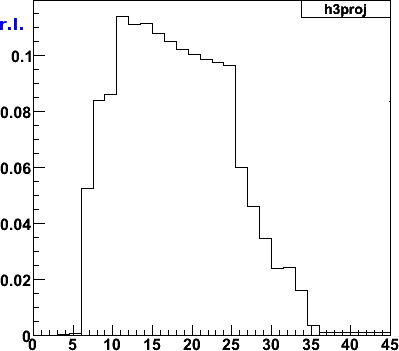
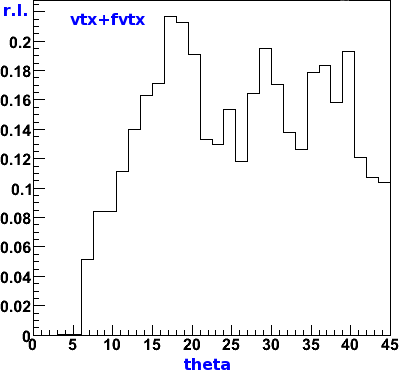
| This is a projection onto the θ-axis.
| 
|
|
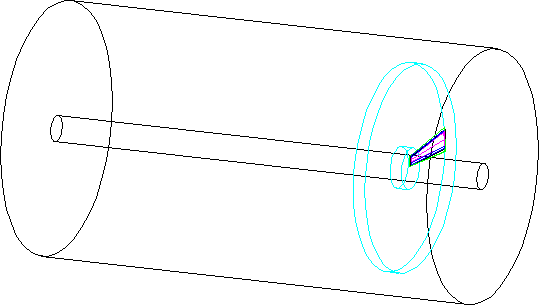
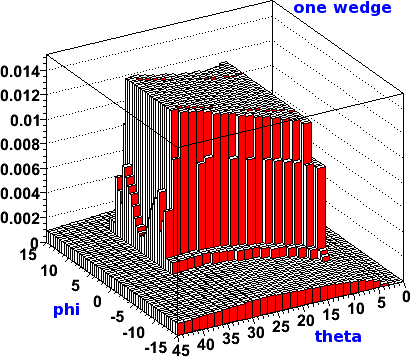
This is disk 10, wedge 0 only, no support disk.
| 
|
| Note that in the lego plot,
the wedge is wider in phi at low theta. That is because a wedge roughly
is a slice in phi, plus extra stuff parallel to it on the outside.
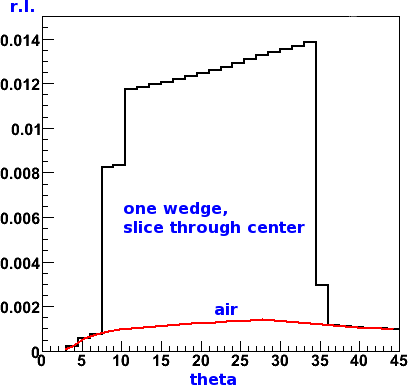
The 2-D plot is a cut through the center.
You can see air,
responsible for about 0.13% r.l.
| 
|
The features in the red air curve correspond to the corners of the
VTX/FVTX enclosure.
| 
|
|
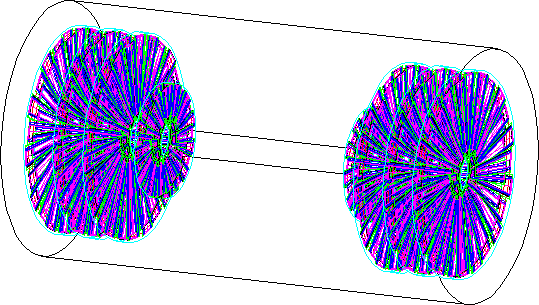
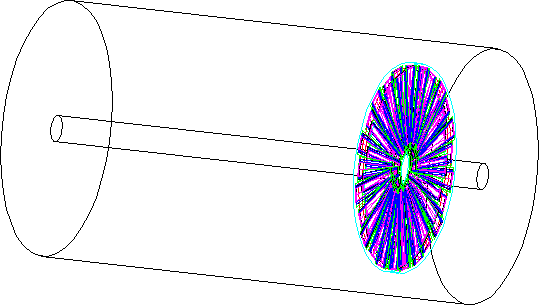
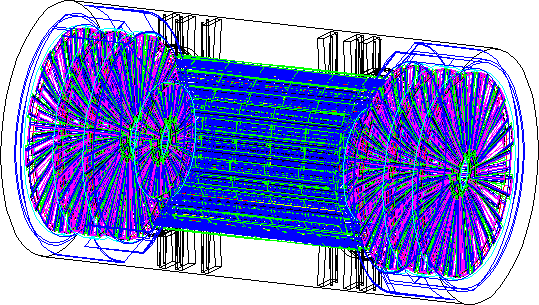
This is the whole detector. You can recognize the various VTX structures.
|
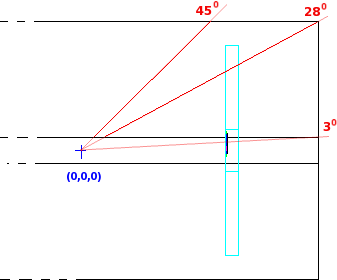
This is the N fvtx , 4 disks,
a 15-deg slice in phi (=2 wedges equiv)
as seen from (0,0,0)
|
|
|
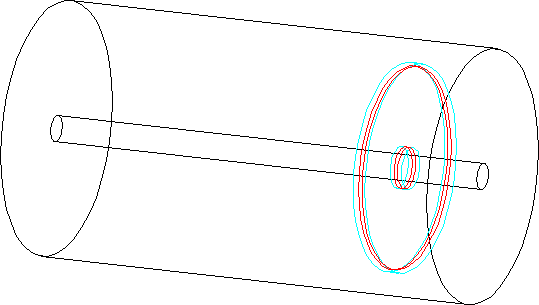
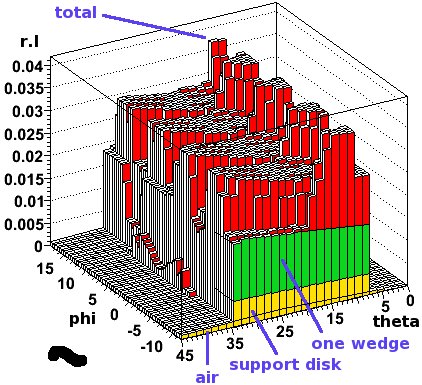
This is disk 10 only (North station 2).
| 
|
| On this figure, the various components are separately
indicated
| 
|
| Thickness of one wedge, plus volume air. Note the
reversed scale to match the plot above.
|
|
|
This is the disk-10, support disk only, just
for illustration.
|
|