| Turn all detectors OFF in pisa.kumac,
and check for volume overlaps
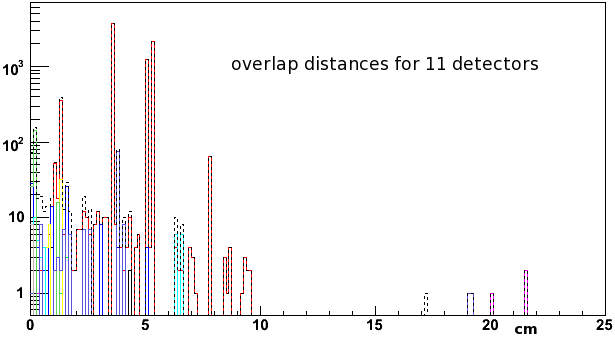
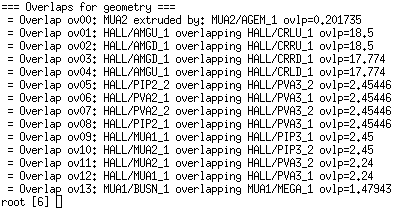
(Here is how). There were 16 cases of overlapping
volumes, ranging from 18cm to many mm. It is not clear what happens in Geant when overlapping
volumes are encountered, but at best the behavior is unpredictable.
This snapshot was taken after
the first set of fixes.
| 
|
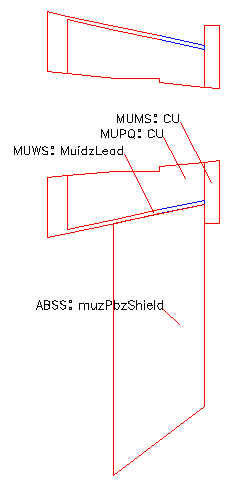
One set had to do with the 'flowerpots' that are mounted on the back
of the CM iron. They consist of a brass cone (MUPP ans MUPQ), with a
layer of lead (MUWS, MUWN) on the outside. The one on the South
conflicted with the prototype of the
new absorber (ABSS). In the process, the problem appeared to be that the
flowerpots were defined too big. The brass was 46cm long, not 50,
and the lead on the back was 6.6cm thick, not 7.0. The lead wrap
was 1/2" thick, not 1cm. Angles were
adjusted. No more overlaps with ABSS (new absorber prototype).
Also fixed the dimensions on the North flowerpot.
[Note I took numbers from the engineering
drawings (as-built), and that the older envelope drawings are wrong.]
Files affected: phnx.par, magnet.f
| 
|
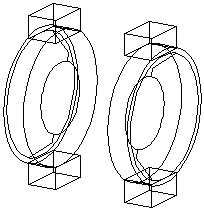
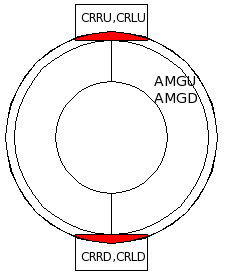
| The next problem set had to do with the CM disks (AMGU, AMGD)
and the vertical
pieces (CRRU, CRLU, CRRD, CRLD) that connect it to the horizontal
return yokes. The problem volumes where the overlaps occur
are shown in red.
| 
|
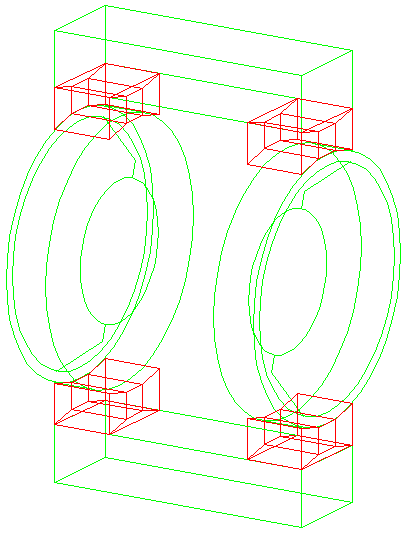
I replaced the blocks with a composite consisting of a block
and three trapezoids (CRR1,CRR2,CRR3).
Files affected: magnet.f, phnx.par
| 
|
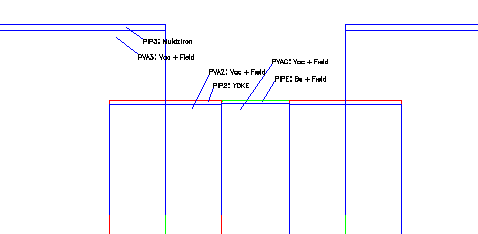
Next, the beampipe. The picture has the vertical scale expanded
greatly. The central piece in green-blue is the BE beampipe filled
with vacuum (PIPE, PVAC), outside of that in red-blue a same-diameter
stainless steel pipe (PIP2, PVA2), and outside of that a blue-blue
stainless steel pipe with a larger diameter (PIP3, PVA3).
You can see the small ss pipe sticks into (=overlaps with) the big ss pipe
by more than a meter. (Same problem with PIPN, also fixed)
There are still questons about where the real boundaries are.
For now, I put the Be-SS weld at +-75cm, and the small-big boundary
at 261cm.
Sources: AN107 fig.4 (1998), drawing RD002-0500-0010A (1995)
Files affected: phnx.par, beam_pipe.f
| 
|
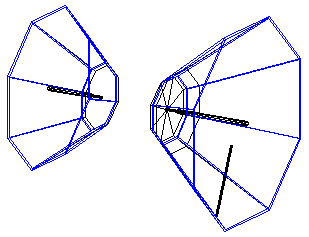
The mother volumes (MUA1, MUA2) holding the Muon N,S lampshades
(MEGA, AGEM) were a bit too
small, and a bus bar (BUSN) ran into the N lampshade (MEGA). I enlarged
MUA1,2 and slid the bus bar to smaller radius.
Files affected: phnx.par, magnet.f
| 
|
After all this, there are no more overlaps or extrusions greated than
a micron in Phenix with all detectors turned off.
|
Next I turned on each subsystem in turn, and noted the number of overlaps
greater than 1mm. Note that these are all likely real errors, since they
are too large for errors caused by roundoffs in calculations, which are typically
at the 10-7 level.
| Subsystem | Overlaps
2010 | Overlaps
2012 | Mean Overlap (cm) | Comments
|
| ZDC | 16 | 17 | 1.10
| Zero-degree calorimeter
|
| SVX | 0 | 13 | -
| This is the Silicon Vertex Tracker
|
| FCL | 5 | 7 | 1.51
| This is the FCL (forward calorimeter)
|
| BBC | 0 | 0 | -
| BBC on with track stack used
|
| ITR | 7880 | 7880 | 4.16
| Latest version of Dch and PC1
|
| CRK | 100 | 80 | 1.30
| RICH with CO2 radiator gas
|
| PAD | 52 | 149 | 0.99
| Latest version of PC2/PC3
|
| AER | 0 | 0 | 0 | -
| This is the AER (aerogel counter)
|
| TFW | 0 | ? | -
| TOF-West
|
| TRD | 0 | 0 | -
| This is the TEC
|
| TOF | 4 | 18 | 15.9
| Time of Flight
|
| EMC | 34 | 763 | 2.46
| EMCal, H.I. with Cerenkov
|
| HBD | 186 | 951 | 0.24
| Hadron-blind
|
| MUM | 129 | 8 | 3.32
| Muon trackers
|
| MUI | 7 | 8 | 17.1
| Muon identifier
|
| RXN | 0 | | 0 | -
| reaction plane detector
|
| MUP | 8 | ?? | 0.10
| Pad chamber for Muon Trigger
|
| MPC | 0 | 0 | -
| Muon Piston Calorimeter
|
| RLT | 0 | - | -
| Relative Luminosity Telescope
|
| All | 8421 | | 3.99
| All 11 offending subsystems
|


