| 
|
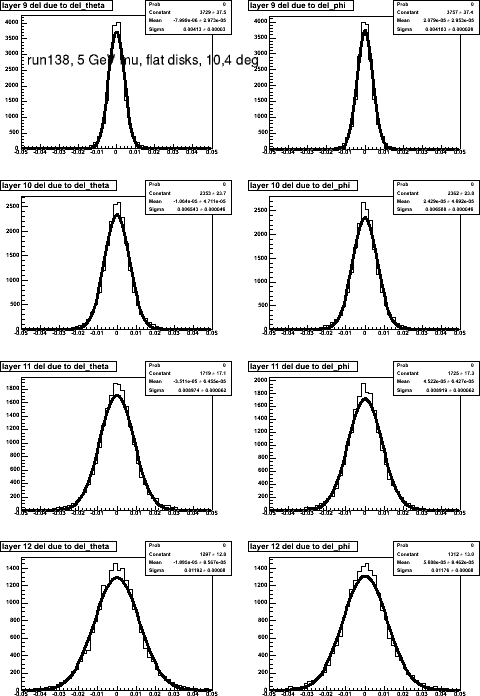
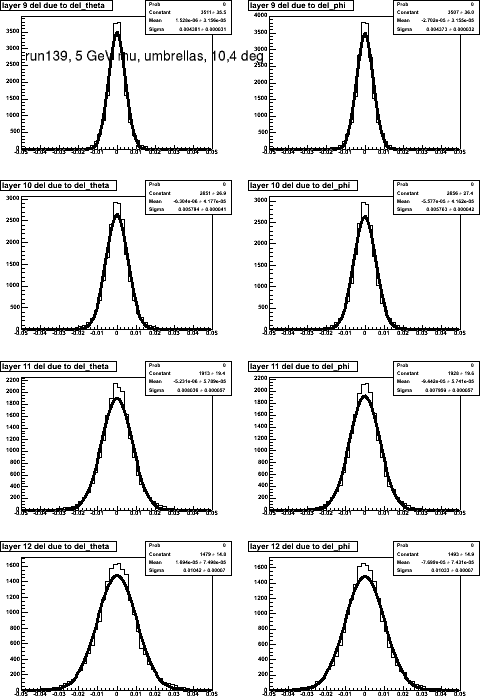
The differences are small, as expected. Since the residuals scale with z, they observed difference is largely due to the different z's of the hits.
| 5 GeV mu+ | residuals (um) | |||||||
|---|---|---|---|---|---|---|---|---|
| run | the phi | zvertex | side view | 9 | 10 | 11 | 12 | comments |
| 138 | 19° 4° | 0 | picture | 41 | 65 | 89 | 118 | flat endcaps |
| 139 | 19° 4° | 0 | picture | 44 | 58 | 80 | 104 | umbrella endcaps |
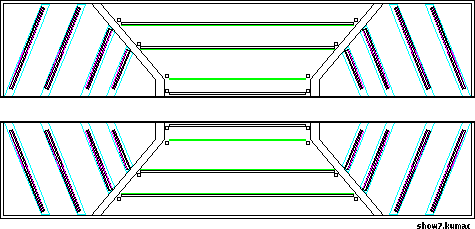
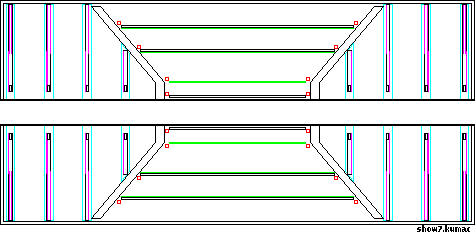
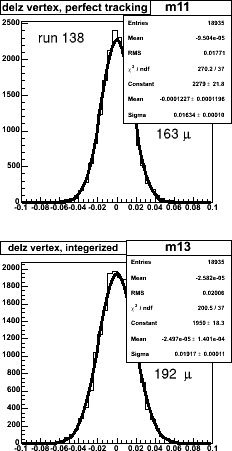
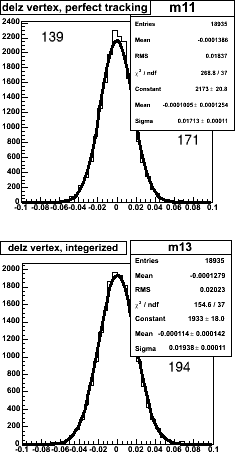
Next, I extrapolated these tracks back to the z-axis using hits in the first and last endcap. 'Perfect tracking' (top plots) uses the hits in the silicon directly, thus seeing only the effects of multiple scattering, and in the bottom plots the hits are moved to the middle of 50-micron strips, causing additional blurring.
Run 138 (flat planes, left column) is marginally better than run 139 (umbrella stations).
Note that these runs use the same algorithm that assumes a single strip is hit, and moves the measured coordinate to the center of the 50 um strip. More on that below
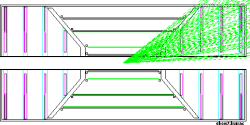
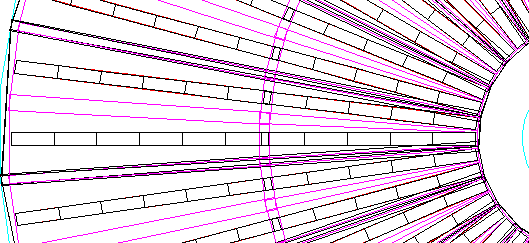
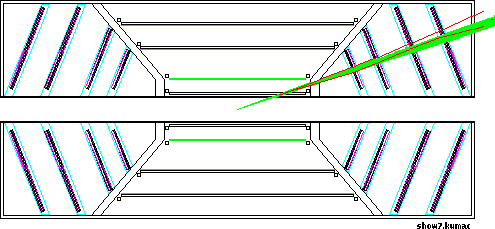
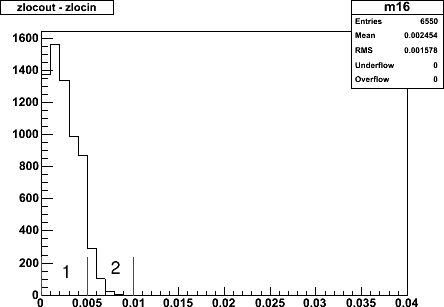
Silicon is 300um thick, and strips are 50 um wide. When the mean angle of incidence is not zero, more than one strip will be hit by each track. I spray 5 GeV muons into the top of the N arm, for z = -10, -5, 0 (shown above), +5 and +10cm.
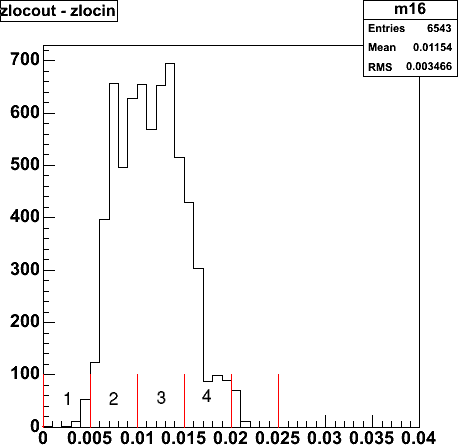
This distribution shows the distance in r between the entry and exit coordinates of tracks in the
silicon. 50-micron intervals are marked in red. Most tracks hit 2 or 3 strips.
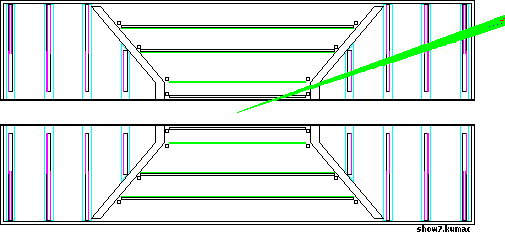
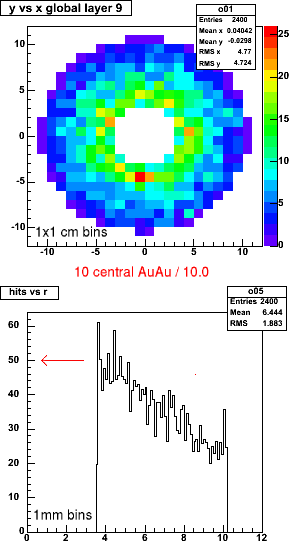
A hit in 3 or 4 endcap planes is required.
A single particle file used:
5 GeV muons, theta, phi = 24°, 3.75°, spread 29°.
Root macro resolution_flat.C.
Run ancsvx_140a-c.root
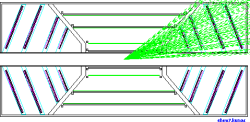
A hit in 3 or 4 endcap planes is required. These tracks are mostly normal to the silicon, and thus the cluster size is typically 1.
Root macro resolution.C.
Run ancsvx_141.root
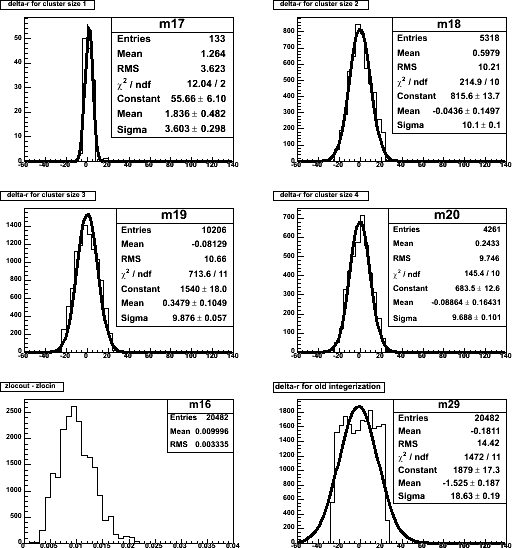
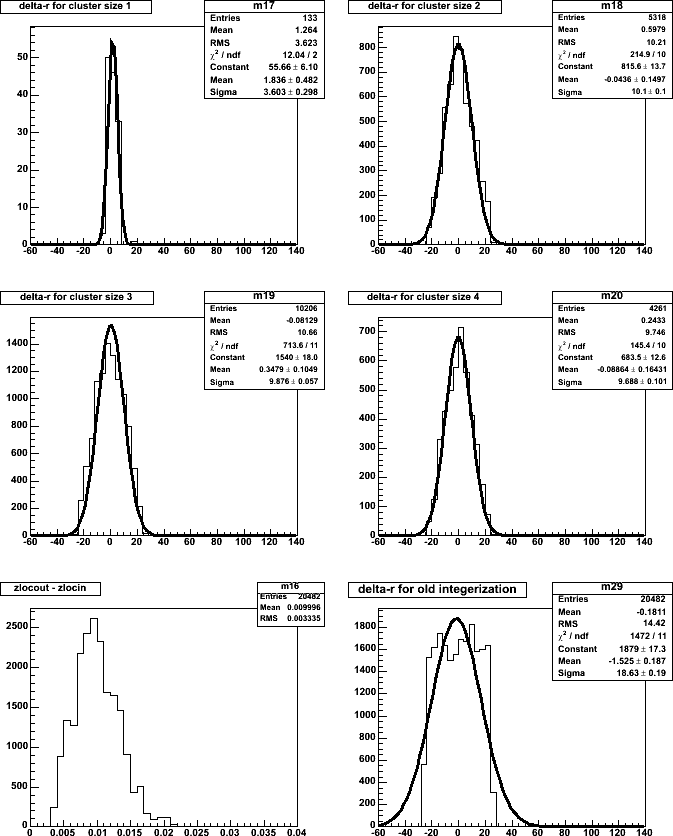
Having a cluster of hit strips rather than a single hit strip improves the point resolution. Just taking the center of a cluster as an estimator of the track crossing coordinate is better than the single-strip center:
| cluster size | sigma (um) |
|---|---|
| 1 | 3.6 |
| 2 | 10.1 |
| 3 | 9.9 |
| 4 | 9.7 |
| weighted avg. | 9.9 |
For comparison (5th plot m29), sigma is 18.6 for normal-incident, single-strip hits. Also note that this distribution is flat, and making the assumption of a gaussian error distribution will negatively affect track fitting algorithms that assume measurement errors are gaussian.
Since all this depends on angle of incidence, I added for this section 5 runs, with z-vertices at -10, -5, 0, 5 and 10cm.
Further resolution improvements will result from making ADC threshold cuts, and ADC-weighted cluster fits.