Thresholds
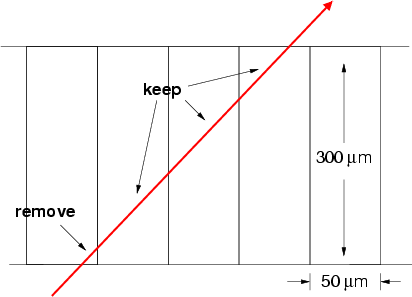
We have to ignore cells where the signal is below some threshold. A particle
traversing 300 um of silicon typically generates 24000 electrons. Setting the threshold
at 2000 electrons, about 10% of this is an equivalent minimum path length of 25 microns.
Strips that are traversed by less than the threshold path are not considered 'on'.
| 
|
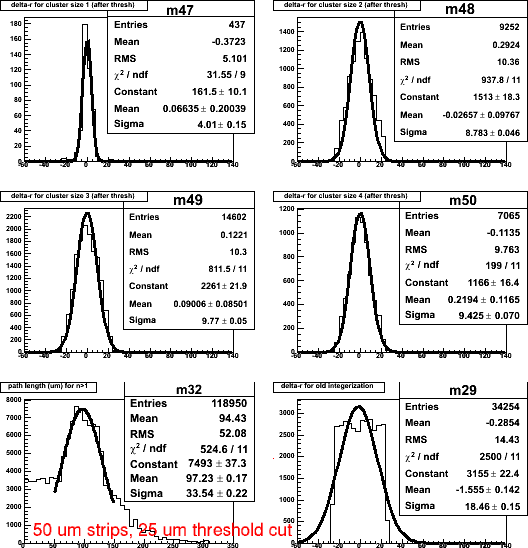
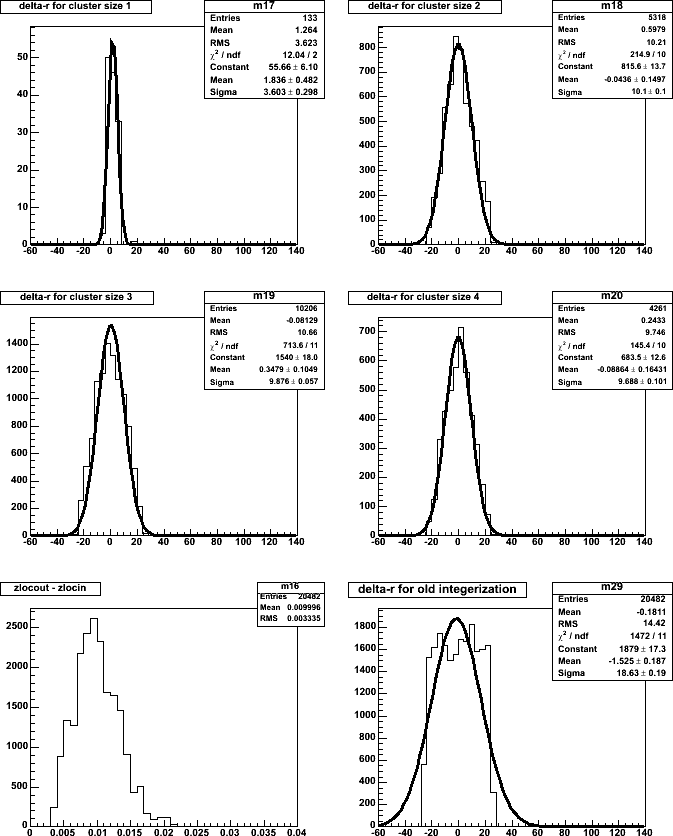
| Applying the threshold cut is expected to somewhat improve the
resolution, and this is what we see:
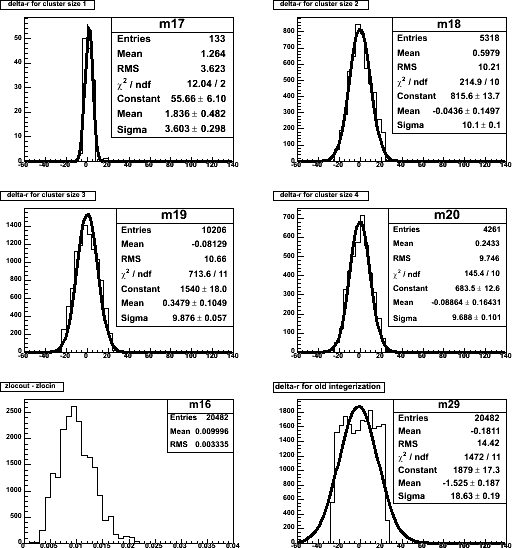
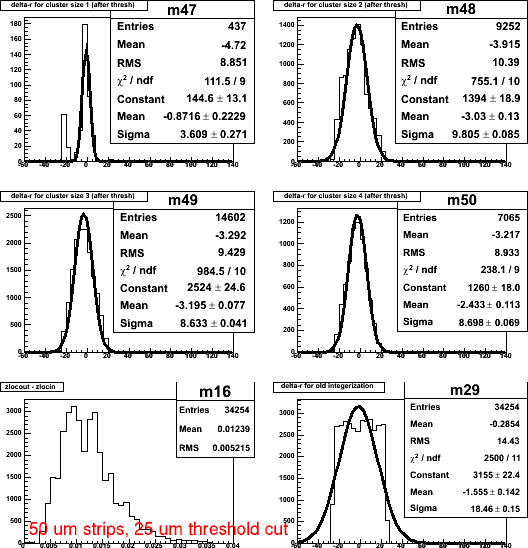
For example, for the most prevalent cluster size of 3, sigma goes from 9.876 to
8.633, a 15% improvement.
The weighted mean is now 8.92 um.
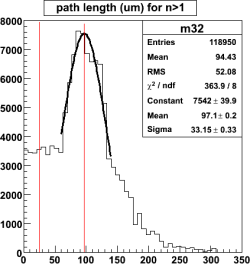
Note that the threshold cut (25) is at 1/4 of the most probable path
length (~100).
| 
|
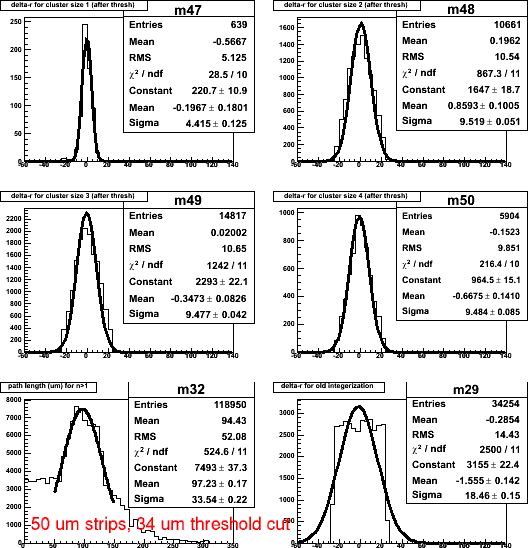
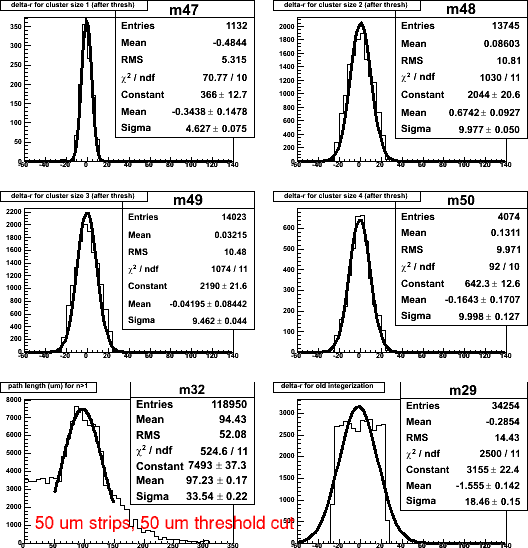
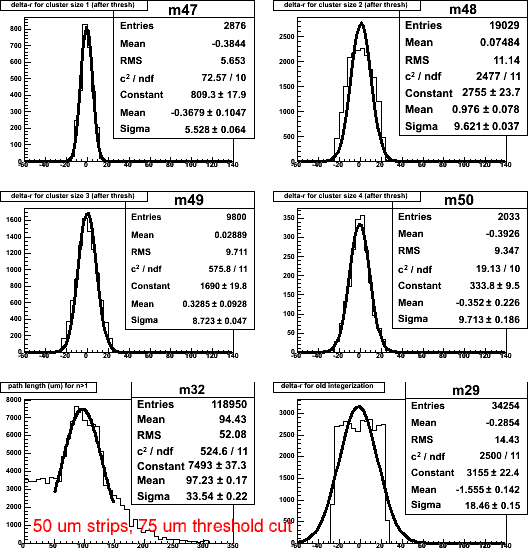
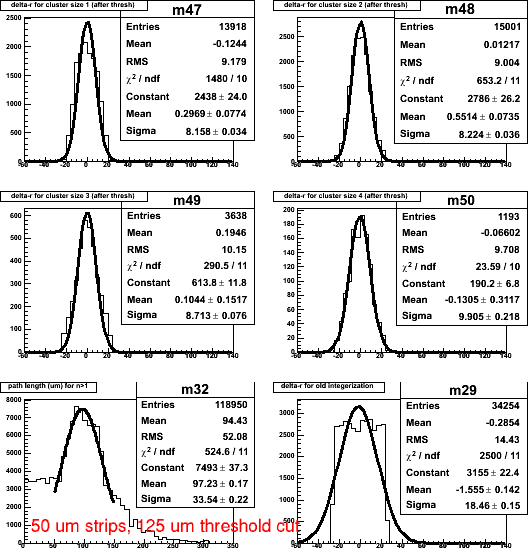
| Increasing the threshold cut is expected to make the cluster size smaller by discarding
more of the first and last hits in a cluster. As expected, the number of clusters of size 1 goes up,
the mean cluster size goes down, the ratio of the 2 most frequent cluster sizes (2,3) goes down,
but the resolution (for simplicity, the sigma of the most popular cluster size) doesn't suffer much.
|
| | Threshold |
|---|
| | 25 | 34 | 50 | 75 | 125 |
|---|
| #clusters size=1 | 437 | 639 | 1132 | 2876 | 13918 |
|---|
| mean cluster size | 2.9 | 2.8 | 2.6 | 2.3 | 1.8 |
|---|
| n3/n2 | 1.6 | 1.4 | 1.0 | 0.52 | .25 |
|---|
| Resolution | 8.6 | 9.5 | 9.5 | 9.6 | 8.2 |
|---|
| Picture | 50x25
| 50x34
| 50x50
| 50x75
| 50x125 |
|---|
|
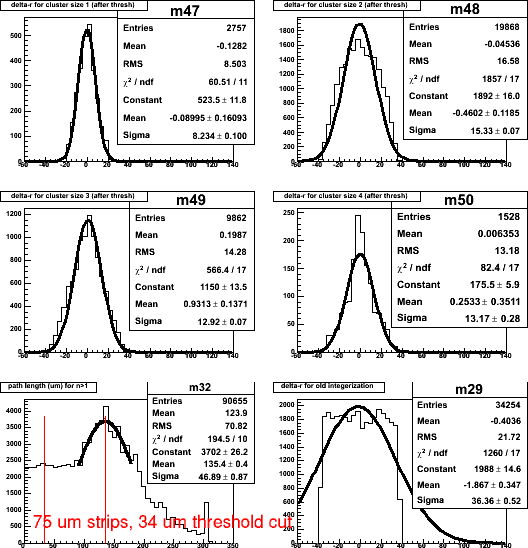
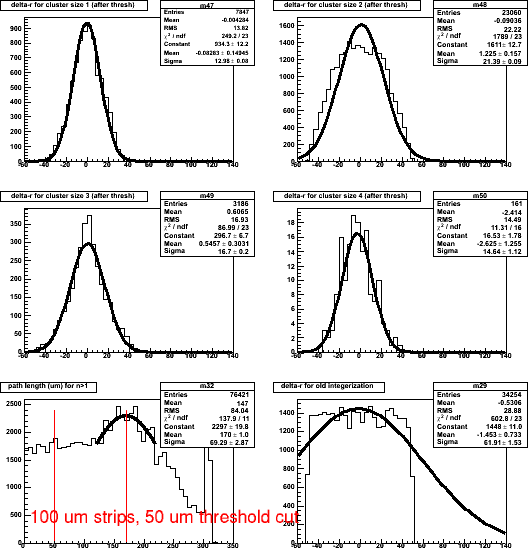
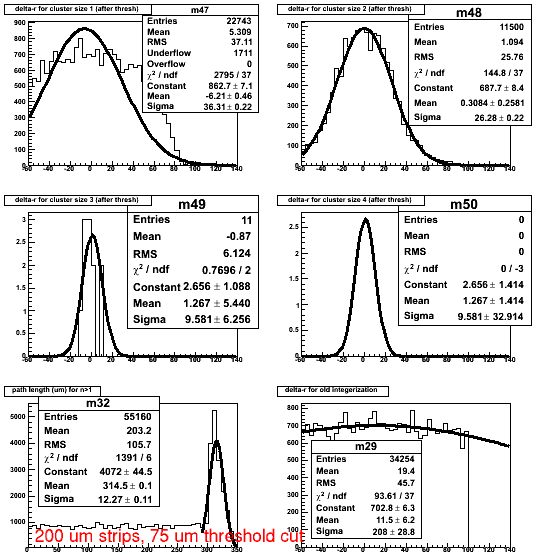
Increasing the strip size while keeping the threshold at approximately 1/4
of the most frequent path length is expected to decrease cluster size and thus data volume.
The resolution (defined as above) suffers accordingly.
|
| | Strip width |
|---|
| | 50 | 75 | 100 | 200 |
|---|
| Threshold | 25 | 34 | 50 | 75 |
|---|
| #clusters size=1 | 437 | 2757 | 7347 | 22743 |
|---|
| mean cluster size | 2.9 | 2.3 | 1.9 | 1.3 |
|---|
| Resolution | 8.6 | 15.3 | 21.4 | 36.3 |
|---|
| strip/sqrt(12) | 14.4 | 21.6 | 28.9 | 57.7
|
|---|
| Picture | 50x25
| 75x34
| 100x50
| 200x75
|
|---|
|