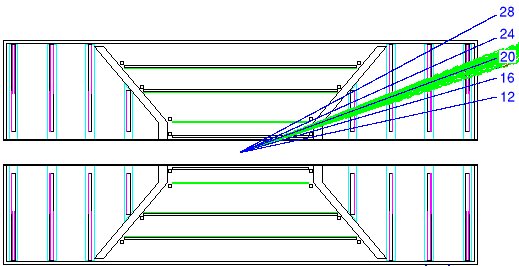
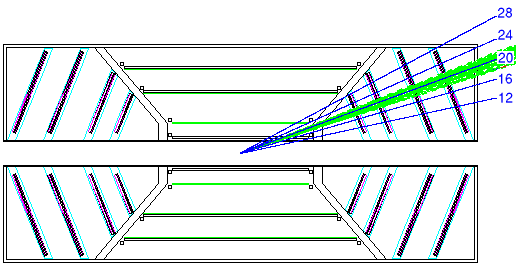
Columns 2,3,4 are for the flat endcap geometry, columns 5,6,7 for the cone-shaped endcaps. Resolutions are sigmas of gaussian fits do delta-z distributions. 'Perfect tracking' means a line is drawn through the pisa coordinates in the first and last plane hit. 'Integerized' means the hit points are moved to the center of a 50 um strip. Most tracks see 4 planes, but at the highest angles you can see from columns 2 and 5 that some tracks see less than 4 planes.
| flat | cones | |||||
|---|---|---|---|---|---|---|
| theta (degrees) | #4 / #3 | resolution perf. tracking | resolution Integerized | #4 / #3 | resolution perf. tracking | resolution Integerized |
| 12 | 1090/25 | 259 | 299 | 1159/0 | 280 | 332 |
| 16 | 1900/00 | 217 | 243 | 1900/0 | 229 | 269 |
| 20 | 1900/00 | 156 | 179 | 1900/0 | 167 | 206 |
| 24 | 1880/15 | 173 | 191 | 1900/0 | 180 | 200 |
| 28 | 1820/70 | 151 | 177 | 1550/300 | 166 | 183 |
|
There is not a lot of difference at this level. I think the 'bump up' of the resolution at 24° has to do with the mass of the barrel pixel layer, which is traversed for track with theta>22° when coming from z=0. The thin blue line scales as 1/sin(theta). | 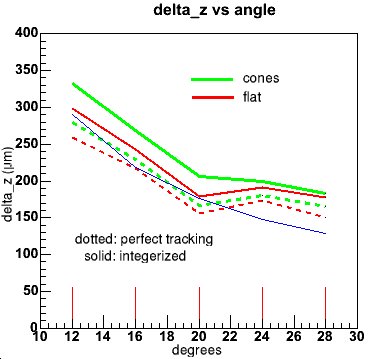
|