| Go to: |
run 2 (runs 2-10 are further down on this page) run 3 run 4 run 5 run 6 run 7 run 8 run 9 run 10 runs 11-12 (on another page) run 13 (on another page) runs 14-16 (on another page) |
 Total chi^2 =  2200.0832258958
 chi^2/d.o.f =  1.09022954702468
 Probability of perfect model =  2.598157455984717E-03

 Fixed parameters:
  ycm =   2.9172000
   fs =   1.0000000
 lamK =   1.0000000
normpi=   1.0000000
normK =   1.0000000

 Variable parameters:
    T =   89.1540624 +/-  10.7406417 MeV
 vT/c =     .5240703 +/-    .0865532
  et0 =    1.8758707 +/-   1.1032839
muB/T =    4.7511487 +/-   2.2679720
  tau =   10.0228409 +/-   3.9937278 fm/c
    R =   11.0210157 +/-   1.4928521 fm
   aT =    -.0735064 +/-    .7969878
  lam =     .5863280 +/-    .0672217

 Calculated Quantities:
 vs/c =     .9941667 +     .0000000     .0000000
 vL/c =     .9541234 +     .0407214    -.3056923
  muB =  423.5842038 +  126.5036827 -169.6470697 MeV
   t1 =    9.6474389 +    3.3384087   -5.1099395 fm/c
   t3 =   33.4748901 +   48.9494066  -18.3320313 fm/c
 WARNING: ITMAX exceeded in amoeba2
t2-t1 =     .3754020 +    6.5796591    -.3754020 fm/c
 dtau =    1.8063586 +    6.3044594   -2.8894995 fm/c
   z3 =   31.9391754 +   50.2665640  -21.6622066 fm
  muS =   29.1389252 +   28.1835668  -19.4548498 MeV
  muI =   -2.4691639 +    1.6553135   -3.0460694 MeV
 Bar# =   41.7205250 +   78.8954651  -30.4463398
Bproj =   20.8602625 +   39.4477326  -15.2231699
Btarg =   20.8602625 +   39.4477326  -15.2231699
brdn1 =    .00425755 +    .01220816   -.00275563 fm^-3
brdn2 =    .00410803 +    .00398629   -.00238532 fm^-3
 Total chi^2 =  1778.073427064439
 chi^2/d.o.f =  .8763299295536912
 Probability of perfect model =  .9999796677857402

 Fixed parameters:
  ycm =   2.9172000
   fs =   1.0000000
 lamK =   1.0000000
normpi=   1.0000000
normK =   1.0000000

 Variable parameters:
    T =   81.3517317 +/-  13.2606103 MeV
 vT/c =     .5776417 +/-    .1472971
  et0 =    1.8441346 +/-    .9923328
muB/T =    5.8959335 +/-   3.2235066
  tau =   12.9461980 +/-   5.1585422 fm/c
    R =   11.6609599 +/-   1.6625828 fm
   aT =    -.4986597 +/-    .4696453
  lam =     .6128164 +/-    .0801392

 Calculated Quantities:
 vs/c =     .9941667 +     .0000000     .0000000
 vL/c =     .9511905 +     .0419576    -.2591809
  muB =  479.6443980 +  165.7723018 -225.9897493 MeV
   t1 =    9.1666055 +    3.7594605   -6.3358354 fm/c
   t3 =   41.9507808 +   47.1630627  -20.5271649 fm/c
t2-t1 =    3.7795925 +    9.6003720   -3.6354408 fm/c
 dtau =    5.4635857 +    8.6866282   -4.1200523 fm/c
   z3 =   39.9031824 +   48.3636862  -24.5207586 fm
  muS =   35.3403362 +   52.3112151  -28.6719180 MeV
  muI =   -2.9005101 +    2.4075098   -7.1196337 MeV
 Bar# =   55.3053770 +  213.8606077  -45.9158301
Bproj =   27.6526885 +  106.9303039  -22.9579151
Btarg =   27.6526885 +  106.9303039  -22.9579151
brdn1 =    .00536662 +    .03108358   -.00444265 fm^-3
brdn2 =    .00369691 +    .01285448   -.00294275 fm^-3
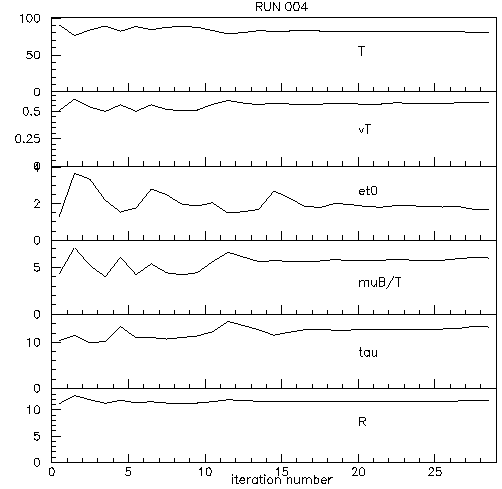
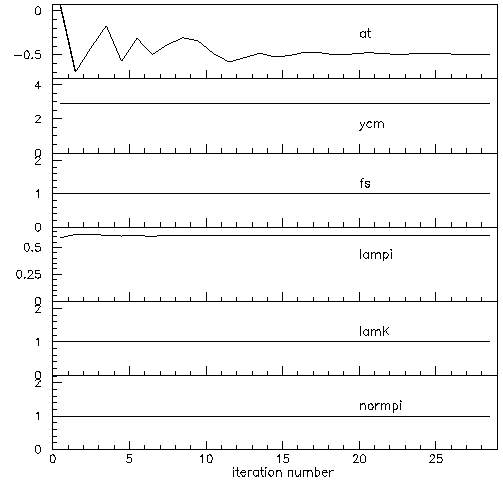
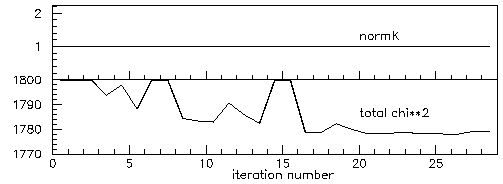
Here is the evolution of the parameters versus iteration:


 **********************************************

 Total chi^2 =  2650.344467409264
 chi^2/d.o.f =  1.30623187156691
 Probability of perfect model =  2.427970617562861E-19

 Fixed parameters:
  ycm =   2.9172000
   fs =   1.0000000
 lamK =   1.0000000
normpi=   1.0000000
normK =   1.0000000

 Variable parameters:
    T =   88.0749915 +/-  12.5109352 MeV
 vT/c =     .5587841 +/-    .0994960
  et0 =    1.8697950 +/-   1.0471382
muB/T =    4.3642801 +/-   3.0582565
  tau =    9.8342649 +/-   4.3294705 fm/c
    R =   11.0914631 +/-   1.6310453 fm
   aT =     .0410438 +/-    .8819925
  lam =     .5727065 +/-    .0671431

 Calculated Quantities:
 vs/c =     .9941667 +     .0000000     .0000000
 vL/c =     .9535755 +     .0405881    -.2770622
  muB =  384.3839341 +  180.5316795 -244.0191154 MeV
   t1 =   10.0340531 +    3.2453745   -3.0651924 fm/c
   t3 =   32.6552751 +   39.9427521  -16.6392593 fm/c
 WARNING: ITMAX exceeded in amoeba2
t2-t1 =     .1997883 +    2.7128800    -.1997883 fm/c
 dtau =    1.5128926 +    7.5622605   -2.8536092 fm/c
   z3 =   31.1392714 +   40.9332066  -19.7911830 fm
  muS =   20.0836201 +   38.1775792  -16.9462500 MeV
  muI =   -1.5760678 +    1.3189215   -4.0126494 MeV
 Bar# =   24.5161148 +   82.1133405  -20.8646577
Bproj =   12.2580574 +   41.0566703  -10.4323289
Btarg =   12.2580574 +   41.0566703  -10.4323289
brdn1 =    .00236400 +    .01107492   -.00190462 fm^-3
brdn2 =    .00241207 +    .00493278   -.00186722 fm^-3
Here is the evolution of the parameters versus iteration:
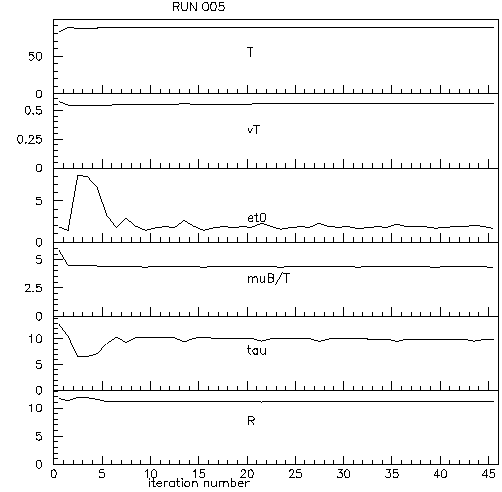
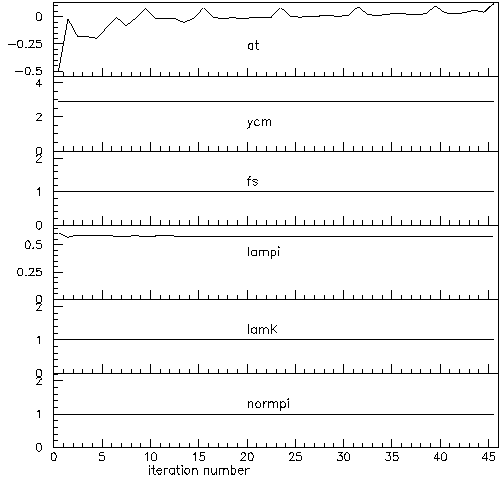
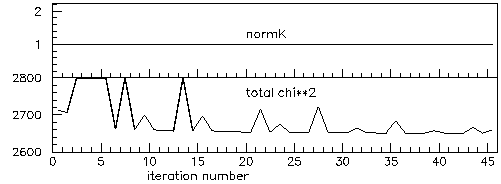
Several technical issues concerning runs 2-5 were fixed.
 **********************************************

 Total chi^2 =  2068.570225832924
 chi^2/d.o.f =  1.01950232914388
 Probability of perfect model =  .2651235498083625

 Fixed parameters:
  ycm =   2.9172000
   fs =   1.0000000
 lamK =   1.0000000
normpi=   1.0000000
normK =   1.0000000

 Variable parameters:
    T =  109.2261733 +/-  11.3869531 MeV
 vT/c =     .5465674 +/-    .0842201
  et0 =    4.9536218 +/-   1.0296980
muB/T =    1.8192319 +/-   3.2280879
  tau =   10.0693106 +/-   2.7229680 fm/c
    R =   10.2318757 +/-   1.4095665 fm
   aT =    -.7203386 +/-    .3193283
  lam =     .6810124 +/-    .0688779
Now for some comments...
 Here is the BEST point !
 **********************************************

 Total chi^2 =  2484.475403123262
 chi^2/d.o.f =  1.06859157123581
 Probability of perfect model =  1.081068643462903E-02

 Fixed parameters:
  ycm =   2.9172000
   fs =   1.0000000
 lamK =   1.0000000
normpi=   1.0000000
normK =   1.0000000

 Variable parameters:
    T =   97.4976145 +/-   3.6718998 MeV
 vT/c =     .6449587 +/-    .0381822
  et0 =    2.8558611 +/-   2.1728179
muB/T =    4.4271434 +/-    .3132801
  tau =   11.0626106 +/-   1.9794305 fm/c
    R =   12.2124798 +/-   1.4931973 fm
   aT =    -.4144854 +/-    .4356278
  lam =     .7009970 +/-    .0755928
Here is the evolution of the parameters versus iteration:
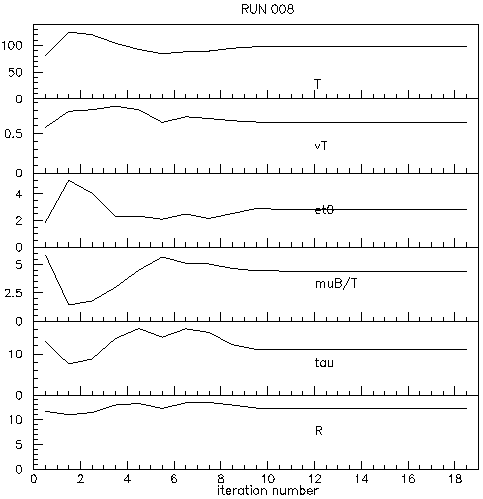

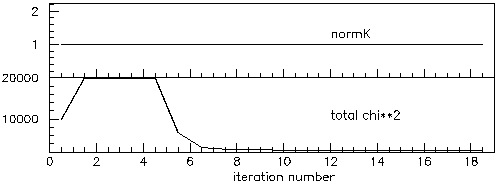
Here is the input parameter file.
This is the complete log file, with the best
point shown here:
 Here is the BEST point !
 **********************************************

 Total chi^2 =  4059.590121781665
 chi^2/d.o.f =  1.82617639306418
 Probability of perfect model =  1.132583283762988E-110

 Fixed parameters:
  ycm =   2.9133600
   fs =   1.0000000
 lamK =   1.0000000
normpi=   1.0000000
normK =   1.0000000

 Variable parameters:
    T =  107.7725581 +/-   4.7494066 MeV
 vT/c =     .6874242 +/-    .0411258
  et0 =    1.3591735 +/-    .4035332
muB/T =    7.0364416 +/-    .2907355
  tau =   13.7627251 +/-   3.1079351 fm/c
    R =   13.8736359 +/-   1.7969432 fm
   aT =    -.2121673 +/-    .4051455
  lam =     .7328811 +/-    .0941394
It turns out that due to the two different behaviors of the '1P' edit descriptor in the output format, the cross sections were a factor 10 too large. ignore this run
Here is the complete log file, and this is the best
point from run 10:
 Here is the BEST point !
 **********************************************

 Total chi^2 =  2399.745783828456
 chi^2/d.o.f =  1.07950777500156
 Probability of perfect model =  4.750309113636794E-03

 Fixed parameters:
  ycm =   2.9133600
   fs =   1.0000000
 lamK =   1.0000000
normpi=   1.0000000
normK =   1.0000000

 Variable parameters:
    T =   97.6856778 +/-   3.6240752 MeV
 vT/c =     .6422318 +/-    .0388430
  et0 =    3.0274715 +/-   2.3138305
muB/T =    4.4120854 +/-    .3072589
  tau =   11.0238382 +/-   1.9513367 fm/c
    R =   12.1437446 +/-   1.4855841 fm
   aT =    -.4392822 +/-    .4210797
  lam =     .7013181 +/-    .0760765
Using this plotfrz input file, I got the following
plots:
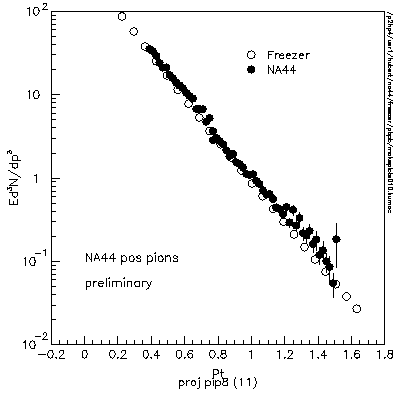 pi+ postscript
  K+ postscript
 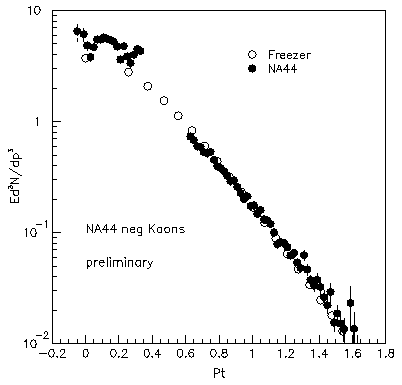 K- postscript