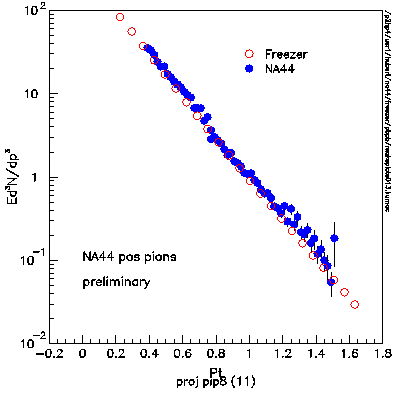
 pi+ postscript
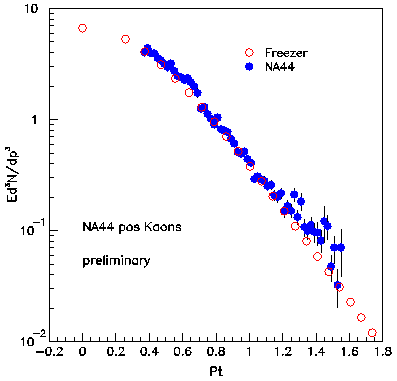
  K+ postscript
  K- postscript
 | Go to: |
runs 2-10 (on another page) runs 11-12 (on another page) run 13 runs 14-16 (on another page) |
Here is the complete log file, and this is the best
point from run 13:
 Here is the BEST point !
 **********************************************

 Total chi^2 =  2167.08898864524
 chi^2/d.o.f =  1.01789055361449
 Probability of perfect model =  .2774391964874108

 Fixed parameters:
  ycm =   2.9133600
   fs =   1.0000000
 lamK =   1.0000000
normpi=   1.0000000
normK =   1.0000000

 Variable parameters:
    T =   95.3957799 +/-   3.5266607 MeV
 vT/c =     .6555016 +/-    .0363092
  et0 =    3.8797202 +/-    .8504497
muB/T =    4.7139807 +/-    .3286298
  tau =   12.5687384 +/-   2.2252282 fm/c
    R =   11.4079766 +/-   1.4089314 fm
   aT =    -.7041592 +/-    .2596383
  lam =     .7006332 +/-    .0737855

 Calculated Quantities:
 vs/c =     .9941219 +     .0000000     .0000000
 vL/c =     .9991470 +     .0006973    -.0038117
  muB =  449.6938666 +   20.4284325  -20.8615881 MeV
   t1 =    6.8362936 +    2.3717766   -4.2643491 fm/c
   t3 =  304.3603217 +  452.9399985 -182.4860763 fm/c
t2-t1 =    5.7324447 +    5.3741337   -2.8406328 fm/c
 dtau =    7.4060118 +    4.3524071   -2.4488403 fm/c
   z3 =  304.1006942 +  453.0785602 -182.8508367 fm
  muS =   42.4901925 +    5.9045185   -5.4682577 MeV
  muI =   -4.1057459 +     .6612199    -.7397983 MeV
 Bar# =  283.7074138 +   91.5093593  -75.4319978
Bproj =  141.8537069 +   45.7546796  -37.7159989
Btarg =  141.8537069 +   45.7546796  -37.7159989
brdn1 =    .01785744 +    .03120322   -.00665947 fm^-3
brdn2 =    .00922878 +    .00286935   -.00229689 fm^-3
Using this plotfrz input file, I got the following
plots:
 pi+ postscript
  K+ postscript
  K- postscript
 (I'm now working on trying to display the correlation functions)
 postscript version