


|
|
|

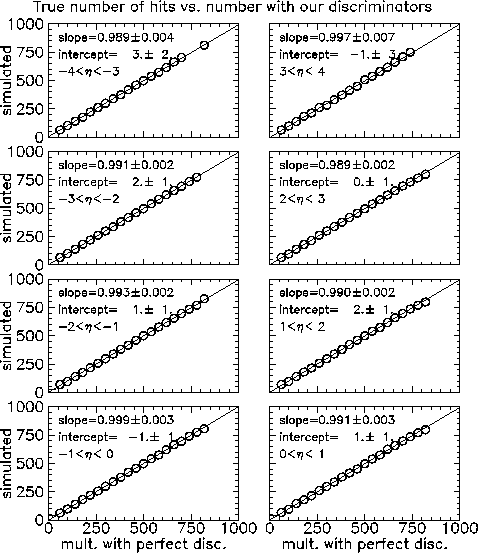
The following plots show the trigger performance as a function of pseudorapidity in the MVD's inner barrel based on discriminator performance measured for prototypes produced in the hp process. As before, the plots show the number of hits with perfect discriminator on the horizontal axis and the number we would expect to measure with our discriminator performance on the vertical axis. In this case, rather than plotting the total multiplicity in the inner barrel, the multiplicity in all strips in bins of delta-z = 5.12 cm (the size of the detector wafers) is used. The slope changes by about 1% (which is comparable to the statistical uncertainties) over this range of pseudorapidity (eta) values. These plots are also available in the original postscript versions.
In October I did a similar series of calculations assuming the
discriminator performance observed for protypes produced in
the orbit process. The discriminator performance was not as good
as seen in the hp process. We have decided to use the hp process
for the chips used in the MVD. Therefore, these older calculations
are not directly relevant to the MVD's expected performance.
However, for reference,
the results of the older
calculations are available here.
John Sullivan
sullivan@lanl.gov
updated Thursday December 18, 1997