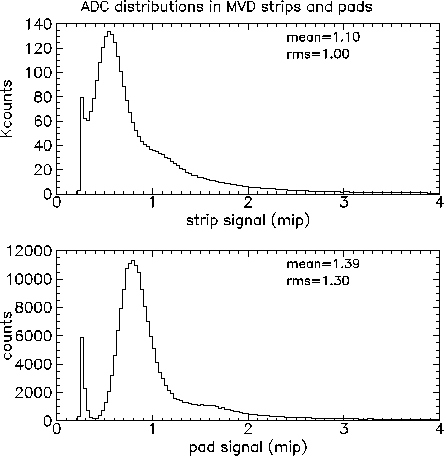
The following plots of the "ADC" distributions in the
strips and pads help to understand the efficiencies seen in these
discriminator studies ( postscript version
also available).

The horizontal axis is in mips instead of ADC channels to
simplify comparisons to the plots
of discriminator thresholds. The overall efficiencies are less than
1 and less than some people might have guessed. Part of the problem
is that a "mip" is defined as the average signal from a mip. The actual
energy loss distribution has a long ("Landau") tail with very high energy
loss values. The result is the the mean is significantly larger than the
most probable energy loss distribution. In other words, the peak of
the distribution is at less than 1 mip. For the pad detectors, the typical
energy loss in a channel is actually slightly larger than the energy loss
from a particle at normal incidence since most particles have an
incident angle of a few 10's of degrees. The result is a typical
signal slightly larger than 1 mip -- which is normally defined
for normal incidence into a 300 micron detector. For the strip detectors
most particles enter the detector at a very large angle relative to
the normal. The result is that the energy loss in a given strip
corresponds to the energy loss in about 200 microns of Si (the strip
pitch). This results in smaller signals than for pads. On the other hand,
the average occupancy of the pads is relatively high for high multiplicity
events -- causing many strips to have multiple hits per channel. This
increases the efficiency of the discriminator (because the signals
are twice as large) at high occupancy/multiplicity values. In the pads
this is probably the cause of the departure of the plots of
true vs. measured multiplicity from linear behavior at high
multiplicities ( postscript plot here ).
These simulations included a simulation of noise in the MVD. The
noise was assumed to be present at a level of 0.1mip (sigma) in
all channels -- whether or not they had a real hit. This just
degrades the resolution for channels with a real hit. For channels
with no hit, it means that there is a pedestal with a width
of 0.1mip (sigma) and a mean of 0. This allows some channels to
be above the discriminator threshold even without a hit.
The tail of this noise/pedestal distribution can be seen in the
"ADC" distributions shown above.


