Expected performance of MVD multiplicity trigger
with the hp process discriminators
John P. Sullivan

Using the set of discriminator thresholds (for the hp process) from
the previous page, some two-dimensional
plots were created.
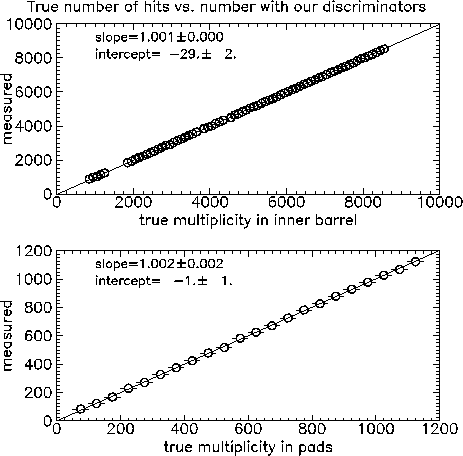
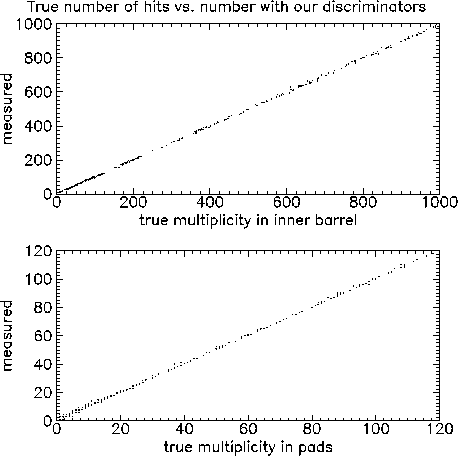
Each pair of plots shows the true number of channels hit on the
horizontal axis and the number we would measure with our
discriminator performance on the other axis.
The true multiplicity is the number of channels which had signals above 0.39 mip
(the nominal discriminator setting).
This is the result we would get with
a perfect discriminator set at 0.39 mip -- it is plotted on the horizontal axis.
The number of hits assuming the performance of our discriminators is shown on
the vertical axis. The two plots show the performance of the inner MVD barrel
and the MVD pad detectors.
For the strip detector, the true number of channels hit is not the number
of particles in the event since most particles hit many strips.
Perfect discriminator would appear on these plots
as 45 degree lines (slope =1) with an intercept of zero and a width of zero.
The following pair of plots
( also available in postscript versions)
shows calculations for higher multilicity events (from 12% to 100% of the
central Au+Au multiplicity).
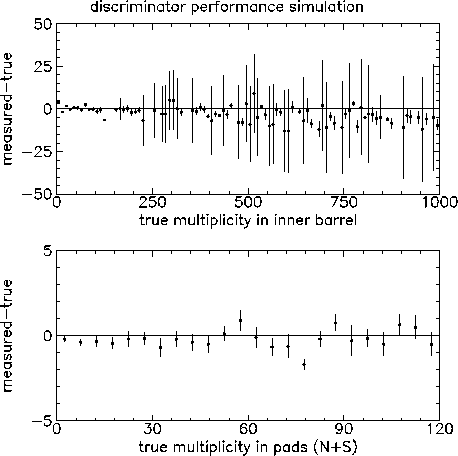
The error bars show the uncertainty on the mean, not
the width of the distribution.
The second pair of plots ( also available
in postscript versions)
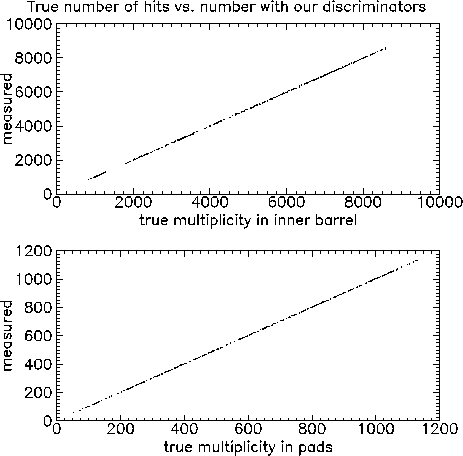
shows the same data as a "scatter plot" of the two quantities.
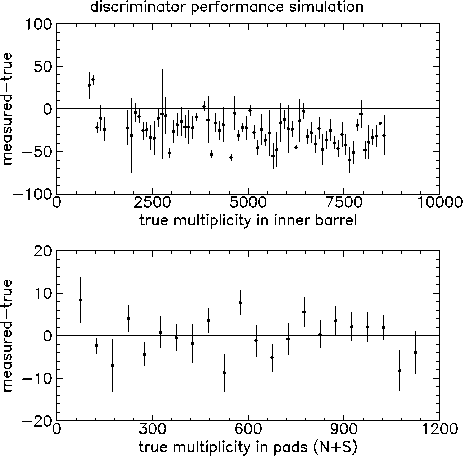
Another way to look at the same information is to look at the deviation
of the measured multiplicity from the straight line fit shown in
the plots above. This is also also available
in a postscript version.
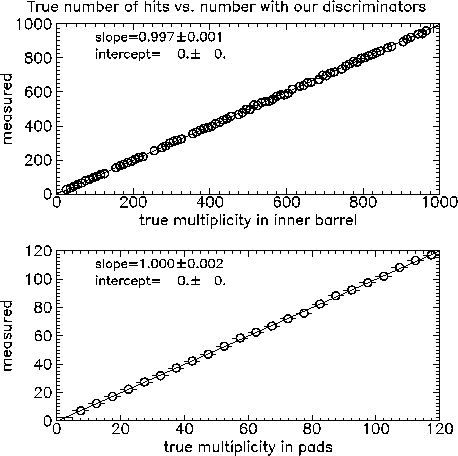
 The same type of calculations have been done with lower multiplicities.
In this case between 0.1% and 10% of the full Au+Au multiplicity
was assumed for the events. The following plots show the results
of these calculations
( also available in postscript versions):
The second pair of plots ( also available
in postscript versions)
shows the same data as a "scatter plot" of the two quantities.
Another way to look at the same information is to look at the deviation
of the measured multiplicity from the straight line fit shown in
the plot above. This plot is also also available
in a postscript version.
In October I did a similar calculation assuming the (worse) discriminator
performance measured for prototype discriminators produced in the
orbit process. We will use the hp process for the MVD's discriminators,
but I have kept the
results of the older (and now mostly irrelevant) calculations
for the reference. A slightly modified set of these plots
(again based on the orbit discriminator performance) was used as part of an IEEE paper.

John Sullivan
sullivan@lanl.gov
updated Thursday December 18, 1997


