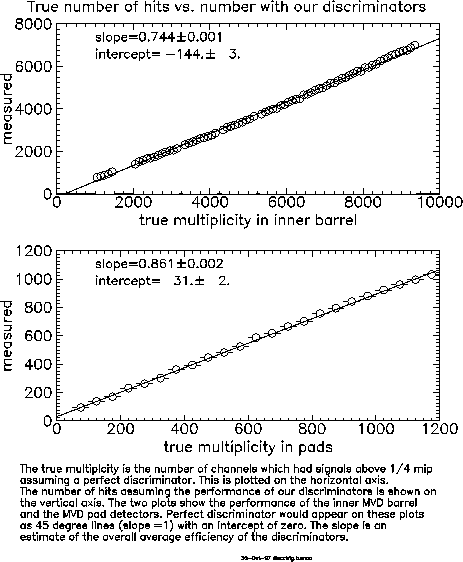
Using the set of discriminator thresholds for the orbit process, some two-dimensional plots were created. Each pair of plots shows the true number of channels hit on the horizontal axis and the number we would measure with our discriminator performance on the other axis. The following pair of plots ( also available in postscript versions) shows the mean number of channels we would measure on the vertical axis -- the error bars show the uncertainty on the mean, not the width of the distribution.

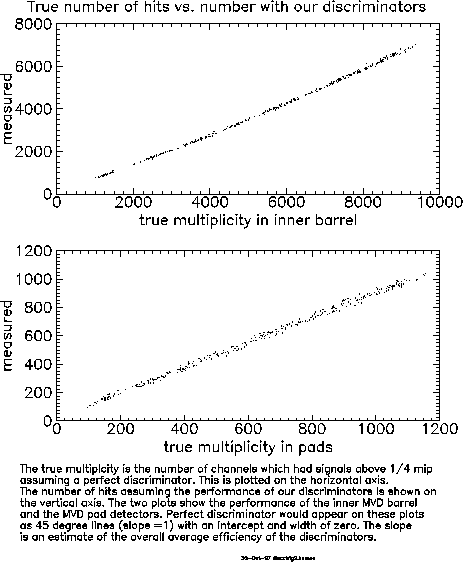
The second pair of plots ( also available in postscript versions) shows the same data as a "scatter plot" of the two quantities.

To model "our discriminator performance", I randomly assigned one of the 64 values from the list of thresholds (see plots above) to each MVD channel. The top plot in each pair of plots shows the performance in the MVD inner barrel (strip detector) and the bottom plot shows the performance for the MVD pads. For the strip detector, the true number of channels hit is not the number of particles in the event since most particles hit many strips.
