Los Alamos National Laboratory
PHENIX-MVD-98-23, PHENIX Note 352
I. Introduction
This note documents the procedures, equipment, and specifications used in the
characterization and evaluation of silicon microstrip detectors for use in the PHENIX Multiplicity
Vertex Detector. Storage of detector data in the internet accessable database is covered in
Appendix B. This note does
not document the use of the laser station or the evaluation of any part of the FEE. A similar
note will be written for the silicon pad detectors in the near future.
II. Detector Specifications
The specifications submitted to Micron Semiconductor call for PIN type, AC-coupled, single-sided, polysilicon biased, silicon microstrip detectors with 256 strips and 2 guard rings. There are two versions of these detectors, long and short for use in the respective outer and inner silicon barrels of the MVD. A complete listing of the physical and electrical specifications for both versions is listed in Appendix A.
Depending on how well they meet these specifications, all detectors will be given a grade of A, B, or J. An "A" grade detector passes all specifications and is suitable for use in the operational MVD. A "B" grade detector meets most specifications and is suitable for use as a spare, or in tests of other components requiring an operable detector. A "J" grade detector is suitable for mechanical tests only. The distinction between "B" and "J" grade detectors is not rigorous, and is determined by need.
III. QA Testing Overview
To test these specifications and assign grades, we have devised the following series of tests to be executed in the order listed. Should a detector fail a test, no further testing on that detector is performed unless there is need for "B" grade detectors, and the detector in question is still suitable. Testing of marginal detectors may be continued at the tester's discretion. When received from Micron Semiconductor, the detectors each come in ~5 inch square plastic cases labeled with the detector's serial number and type. In addition each detector comes with its associated test structures packaged separately in a similar case with the same serial number as its corresponding detector and the label "test structures". As the detectors themselves have no identification on them, it is important to keep them associated with their correct serial numbers via labels on either their original shipping boxes, or their mounts. Detector mounting will be discussed in detail later in this document. Upon receiving, the initial database records are created for each detector. See appendix B for details.
As temperature and humidity can affect the electrical characteristics of silicon devices, the specifications require that all measurements be made at 21 deg. C (+/- 3) and at a relative humidity of less than 50%. This may require that the detectors and test structures be acclimatized in a controlled environment for a certain time before testing. Ordinarily this will not be necessasary as the clean-tent, where all tests will be performed, is usually within the temperature and humidity ranges specified.
The data produced in these tests are stored in three seperate places. First, as each test is performed, the relevant data are entered into the Silicon Strip Detector Database. This is an internet accessible database located at BNL. Appendix B details its use and location. Second, all data files are stored on the Macintosh Quadra 610 in the clean-tent for eventual burning onto CD-ROM using the "CD Burner" application. Lastly, printouts of all data files or graphs are stored indexed by serial number in the white three-ring binders on the bookshelves in the back of the clean-tent. Each of the following test descriptions specify exactly what data to store where and in what form for each individual test.
The following test descriptions are listed in the order performed and specify the equipment used, output data formats and storage locations, and the specifications addressed. Schematic diagrams and illustrations are included where needed. This sequence of tests, when completed, will generate all data needed for strip detector final evaluation and grade assignment.
IV. Readout Capacitor Shorts
Testing of the readout capacitors for shorts is performed by the manufacturer, Micron Semiconductor, as part of their in-house QA procedures. Data from these and other tests are shipped with each batch of detectors. We have found it more efficient to simply accept these results at face value, so the channels listed by Micron as shorted are simply entered into the database (see appendix B, section III). Note that the bad channel spec calls for fewer than 4 bad channels total, including dead, high current, low breakdown (see section XI. Individual Channel Leakage Current vs. Bias Voltage), and shorted channels.
V. Test Resistor Measurements
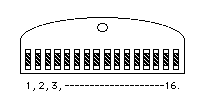
The first test performed is the resistance measurement of the 16 polysilicon test resistors included in the test structures for each detector. These test resistors reside on their own piece of silicon illustrated in figure 1. (note that the numbers in the diagram show our numbering scheme and are not present on the actual silicon wafer)

The test piece should be manipulated only with a vacuum pen, and placed directly on the vacuum chuck of the probe station, using the vacuum to hold it in place. The measurement is performed using two probes, set down on the contact pads at each end of each test resistor, connected straight to a multimeter in resistance mode. The resistor numbers and values, along with the date, time, temperature, humidity, and names of those performing the test are recorded on a "T Resistor worksheet" (an Excel document stored with the VIs on the Macintosh Quadra 610 in the clean tent) and entered in the database (see appendix B for details on database entry). The completed "T Resistor worksheets" are stored in the binders.
VI. Test Diode Capacitance vs. Bias Voltage Measurements
Data taken from 2-60 V at 1MHz test frequency.
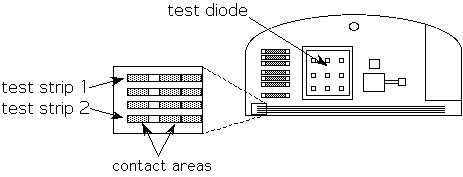
The second test is a measurment of the test diode capacitance as a function of bias voltage. This gives us an indication of the depletion voltage of the detector, but is not sufficient to determine spec compliance (see section XII. Alpha Source Testing of Depletion Voltage). The test diode is the large waffle structure slightly off center in figure 2. Unlike the test resistors, the test diode must be tested in complete darkness to eliminate photoelectric effects.
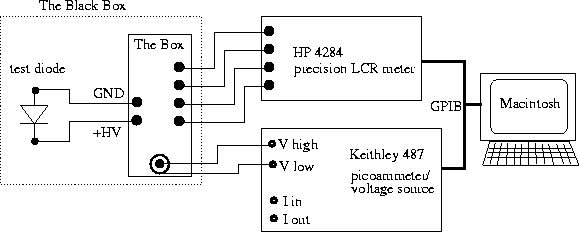
To set up for this test, the test piece is mounted on the vacuum chuck. Two probes are used to make the electrical connections to the backplane and the top of the test diode. Since the test diode is so large, the tips of these probes should be inverted so as to use the bend as the contact point and preserve the points for other tests that require the precision afforded by the probe tips. These probes are connected to a special box within the RF black box enclosure that combines the two bias lines with the four measurement lines from the HP 4284A Precision LCR meter (see figure 3 for a schematic diagram). The backplane (via the chuck) is connected to the box terminal labeled "HV" and the top of the diode is connected to the box ground terminal. The voltage source of the Keithley 487 is connected to the BNC connector on the bottom of the box (outer = ground). The HP 4284A makes the capacitance measurements.
Both instruments, and the measurement run, are controlled by a LabVIEW Virtual Instrument (VI) running on a Macintosh computer via GPIB connections. The VI is called "single C-V.vi" and is located in the directory "Macintosh HD:Dave's stuff". To run the VI, the user must first set a few input variables. The first is labeled "Detector Description". Generally the serial number of the tested detector is entered here. Whatever character string is entered in this control, e.g. "123", will be concatenated with "_CV.txt" to create the data file "123_CV.txt" in the "detector data" sub directory. Next the user decides whether the data file should be appended to or overwritten by toggling the "Data" button. There is generally no reason to append to these files, so overwrite is the default. The VI has one default test frequency of 1 MHz since the database is formatted to accept only datafiles with a single test frequency. If the user wishes to use another or multiple test frequencies, these must be entered in the "test frequency" control. Lastly the "Max. Bias" control must be set to the appropriate value (default is 60V). There is also a spy function that allows the user to monitor the CV data of one test frequency as it is measured. To do so, simply set the "spy freq." control to whichever test frequency you wish to monitor. At this point the VI is ready to run. In running, the VI increments the bias voltage in one volt steps, stopping at every second voltage to take measurements. At each measurement voltage, the VI cycles through the test frequencies, taking capacitance measurements for each, and storing the data in a two dimensional array. Once the maximum voltage is reached, the VI automatically ramps the bias back down to zero, writes out the data file, and beeps to inform the user that the run has completed.
Once the data is taken, a graph is made of bias voltage vs. 1/capacitance2 and printed for storage in the binders. The calculations for this can be done with either Excel, or Kaleidagraph. This graph should rise steeply and then level off suddenly. The depletion voltage is the first voltage just past the transition "knee". The raw data file is burned onto CD-ROM and entered into the database along with the date, time, temperature, humidity, and names of those performing the test (see appendix B for details).
VII. Coupling Capacitance
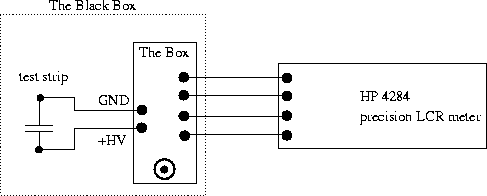
The coupling capacitance between the aluminum readout strips and the P-inplant strips is a major factor in the signal to noise ratio of the detector. To test this specification, capacitance measurements are made of four of the test strips located on the silicon wafer test pieces. Each of two main test pieces have four test strips each. Figures 2 and 4 show these pieces, the test strips, their numbering scheme, and contact areas. Note that only the outer two test strips on each piece are tested. Testing is done using a 1 MHz test signal from a HP 4284A Precision LCR Meter applied to the contact areas through two probes. Figure 5 illustrates the test setup. No bias voltage is applied, but the measurement must be made in the dark as the measurement is sensitive to incident light. The data are recorded on a "T Capacitor worksheet" (an Excel document stored with the VIs on the Macintosh Quadra 610 in the clean tent) and then entered into the database along with the date, time, temperature, humidity, and names of those performing the test (see appendix B for details).

VIII. Coupling Capacitor Breakdown
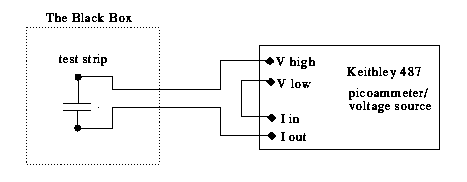
Measurement of the coupling capacitor breakdown voltages are made on any one of the test strips. In this test, the voltage source and ammeter are connected in series with the coupling capacitor as illustrated in figure 6. Since the device is a capacitor, it should pass no current until the silicon dioxide dielectric breaks down and essentially shorts out the capacitor. This will be marked by a sudden current of hundreds of microamps or more. The specifications call for a breakdown voltage of > 65V, but in testing 14 detectors, we have yet to see one test strip that breaks down at less than 100 Volts. So it has been decided to save time by testing only one test strip to 100 volts bias. The wafer's performance should be consistent enough across its face to ensure that if one test strip breaks down at > 100V, none of the strips, either on the test pieces or on the detector, will break down at less then the specified 70V. Once a strip has broken down, the capacitive coupling is permanently destroyed, rendering the test strip useless for any other testing. This measurement is made in the Black Box as a precaution; incident light may or may not affect it significantly. The data are recorded on "T Capacitor worksheet" and then entered into the database along with the date, time, temperature, humidity, and names of those performing the test (see appendix B for details).
IX. Detector Thickness
The detector thickness will be determined by measuring the thickness of the test resistor test piece, so as to not physically damage the detector itself, with a micron resolution micrometer. We assume that the wafer thickness is consistent enough for this one measurement to be sufficient. The data will be recorded in a log book and entered into the database along with the date, time, temperature, humidity, and names of those performing the test (see appendix B for details).
X. Mounting
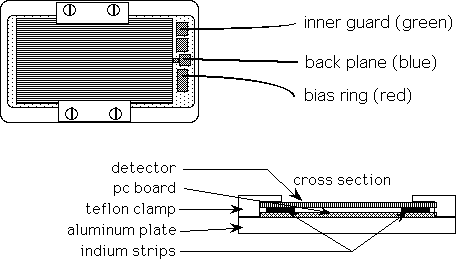
At this point, all surviving detectors, i.e. those whose test structures have passed all of the preceding tests, are mounted for final testing of the detectors themselves. The detector mounts consist of an aluminum plate approx. 4 x 3 x 1/4 inches. On the top surface of the plate is a shallow relief that receives a copper coated G10 board. Located on either side of this pc board are Teflon clamps that hold the detector and the pc board firmly to the aluminum base plate. The copper on the G10 board is cut away into four separate traces for the backplane, bias ring, and inner and outer guard rings of the detectors. On one end of these traces are large pads for soldering to color coded lead wires for connection to multimeters, voltage sources etc. The three leads are: Red = bias line, Blue = back plane, Green = inner guard ring. The other ends (except for the backplane trace) stop just short of the edge of the detector and are connected to their proper detector structures via gold wire bonds. The backplane trace is connected directly to the detector backplane through two strips of indium simply pressed between the detector and the G10 board. Both the aluminum plate and the G10 board have 0.5 inch diameter holes in the center to hold an alpha source for depletion testing. Once mounted, the detectors are sent off to be wire bonded. Only the bias line and inner guard ring will be wire bonded since the outer guard ring is floated in all testing and during operation. Figure 7 illustrates a mounted detector. Once bonded the detectors are ready for burn-in and final testing.
XI. Burn-in, Total Strip & Inner Guard Ring Leakage Current Measurements.
After mounting, the detectors are burned-in by the application of 50 V reverse bias for at least 72 hours to eliminate transient electrical effects caused by the detectors response to sustained bias. During this time they are also allowed to acclimatize to the temperature and humidity environment required by the specifications for the remaining tests. This burn-in will take place in the White Box to eliminate photocurrents, and can be performed on up to 17 detectors at a time, automated by the Macintosh.
To set up for the burn-in process, the detectors are placed on a pigeonhole/shelf in the white box. Each detector slot has a label from 1 - 17 that corresponds to a bundle of cables that connect each detector to the bias supply. Each bundle has three color coded wires: red - for the bias line, blue - for the backplane, and green - for the inner guard ring. Each of these wires ends in a micro-clip connector of the same color except for the green inner guard ring line which has a black connector (the supplier was out of green). These are clipped to their proper detector leads which, coincidently, have the same color code scheme (see figure 7). A list must be made identifying which detector serial number goes with which burn-in slot (1-17); this will be entered into the VI to identify which data goes with which detector. The white box is then closed and sealed with electrical tape to ensure light-tightness.
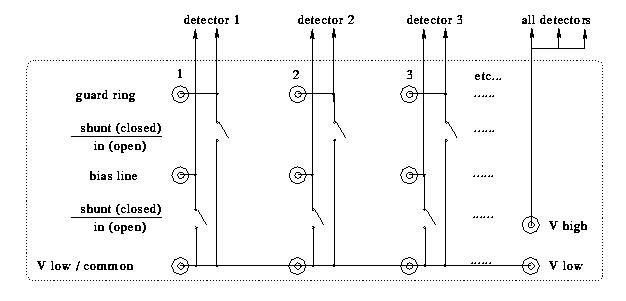
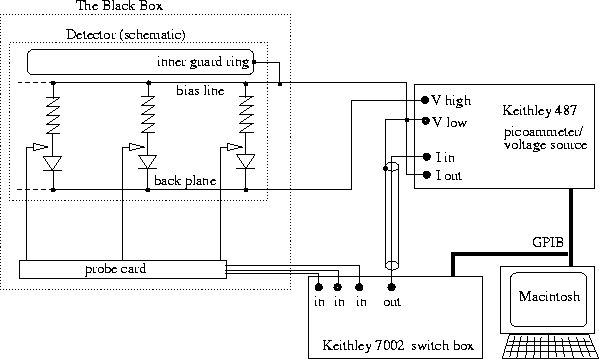
Figure 8 is a schematic diagram of the switch board, located on one side of the White Box. The front has a total of 18 subsections: 1 set of connectors and switches per detector (17), plus the last section on the right containing the "V low" and "V high" Lemo connectors. Each detector subsection contains three Lemo connectors, and two single-pole-single-throw switches. Each of the two input Lemos (labelled "guard ring" and "bias line") are connected to the "V low / common" Lemo through a shunt switch. For the burn-in a Keithley 487 voltage source will be plugged into the "V high" and "V low" terminals to provide bias voltage, and all switches will be set to "shunt".
Figure 9 is a schematic diagram showing the complete setup for the burn-in process. Each guard ring and bias line lemo is connected to the input terminals of the Keithley 7002 switch system via coaxial cables. The inner guard ring lemos for detectors 1-17 are connected to switch channels 1-17. The bias line lemos for detectors 1-17 are connected to switch channels 18-34. As of now, the switches are all left in the "in"(open) position for burn-in and are not changed. The switch board was designed before the process was automated using the Keithley 7002 to switch between detectors and measurements, so the switches are now vestigial features as are the common/low/ground lemos.
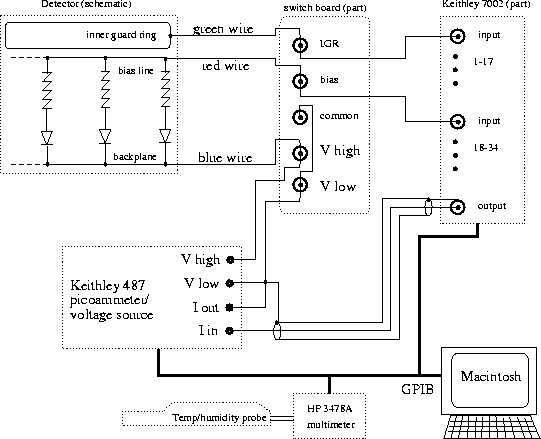
The switch box output coax line is split into two lines. The inner conductor, which carries the leakage current selected by the switch box, goes through the ammeter and then to the common/ground/low. The outer conductor, which carries the net leakage current of all the unselected bias and inner guard lines for all detectors, goes straight to common/ground/low. Since the switch box is configured so that a closed switch connects its input to the output center conductor, and an open switch connects its input to the output outer conductor, all detector structures are biased throughout the measurement/burn-in process, with only a negligible break as the switches are actuated. Essentially the switch box simply detours a single leakage current at a time through the ammeter on its way to ground. The Keithley 7002 and 487 are controlled by the VI on the Macintosh via GPIB cables. Temperature and humidity data are read by a temperature/humidity probe translated by the HP 3478A multimeter and readout via GPIB.
The burn-in process and simultaneous measurement of inner guard ring and total strip leakage currents are controlled by the VI "burn-in.vi" Initialization proceeds as follows. The "Burn-in voltage" control is set to the desired voltage or left at the default 50V. The "Measurement Interval" (time between measurements) defaults to 1 hour. This VI has a excess current cut-off feature that can be turned on or off by the "Excess Current Cut-off" button. Additionally the cut off level can be set by the "Current Cut-off level (uA)" control. Should the cut-off engage, the bias voltage goes to zero, the "VI shutdown" light turns red, and execution of the VI stops. Since this VI writes the data out to files after every measurement, all data taken previous to the shut-down is saved. Lastly, and most importantly, the detector serial numbers must be entered in the "Detectors Present" control box. If detector 1234-56 is hooked up to slot 5, then "1234-56" must be entered in window 5 of the "Detectors Present" control box. Between 1 and 17 detectors may be burned in at a time, but it is crucial to the execution of the VI that they be connected and entered into slot 1 through X with no gaps. Once the burn-in is started, detectors can be removed from the measurement list by deleting their serial numbers from their proper "Detectors Present" window. In this case, the number "-777" will be substituted for a current measurement in the data files. Lastly, there are two chart displays for monitoring the leakage currents of whichever detector slot is selected by the "Spy Detector Number" control. The VI is now ready to execute.
When started, the VI checks for detectors present, ramps the bias voltage to the user specified level, and takes the first measurements of temperature and leakage current. Just before the first measurements are taken, approximately 1 minute from go, the VI creates two files for each detector present, one for the inner guard ring data and another for the total strip data. The file names are the detector serial numbers concatenated with either "_IGR1.txt" or _strips1.txt", and are located in the directory listed in the "Data Files Directory" window. If no detectors are present an error window appears and execution stops. Each file contains a comma delimited spreadsheet/text file with four columns and a line of column headers: sequence #(something the database needs), time (hours since start), temperature (F), and current (nA). After one measurement interval, another set of measurements is made, the files opened, the new data appended, and the files closed again. The VI then waits for another measurement interval, and repeats the process. This will go on indefinatly until the user terminates execution by hitting the "Execution" stop button. During the interval between measurements, the VI checks every minute to see if the user has terminated execution. If not, it proceeds normally. If so, it ramps the voltage down to zero and beeps. The termination process takes a total of 1-2 minutes. Direct termination of the VI using the LabVIEW stop button has no adverse affects save that the user must ramp down the voltage manually. The data is then plotted in Kaleidagraph, the plots stored in the binders, the raw data files saved on CD-ROM and entered into the database along with the date, time, temperature, humidity, and names of those performing the test (see appendix B for details).
XII. Individual Channel Leakage Current vs. Bias Voltage
The individual channel leakage current vs. bias voltage measurement is one of the most involved and informative tests done. The results tell us the number of dead channels (zero or negative currents at high bias), the number of channels that draw excess leakage current (>10nA at 50V), channels with low reverse bias breakdown voltages (>100nA at 70V) and also indicate the presence of low interstrip resistance regions on the detector. Note that the bad channel spec calls for fewer than 4 bad channels total, including dead, high current, low breakdown, and shorted channels (see section XIII. Readout Capacitor Shorts).
A low interstrip resistance region is indicated when part of the detector seems to draw negative currents at bias voltages > 15V. If the region is entirely contained within the channel range of a single 32 channel measurement (channels 1-32, 33-64 etc.), there will be a region of negative currents in a graph of leakage current vs. channel number for bias voltages as high as 60V. If the region is not entirely contained within a single measurement range, the channels closest to the edge of the probe card will show abnormally high positive currents, increasing in magnitude closer to the edge of the measurement range. This creates the "circus tent structure". Also, there may be a regular negative variance in the current of every fifth channel in the bad region. The presence of either of these structures is grounds for automatic rejection of the detector. While these indicators are a reliable means of detecting low interstrip resistance regions on the detectors, it must be understood that these data are produced by an interaction between the test equipment, particularly the 7002 switch box, and the bad region of the detector and are therefore not truly indicative of the leakage performance of the region in question. Probing the same region with a single probe will not produce the same data. Finally, it should be noted that we believe this problem to be confined to detectors with a polyimide passivation coating only. As all future detectors will have silicon dioxide coatings, we don't expect to see this problem again.
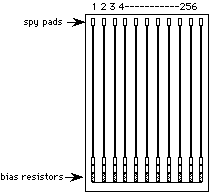
For testing, the detector is held securely in a bracket that fastens to the top of the probe station chuck with a binding screw. The detector itself is fitted into a socket on the top of the bracket and secured by another binding screw. Bias is supplied by the voltage source of a Keithley 487 picoammeter/voltage source via the wire leads on the detector mount(see figure 7). A 32 pin probe card is then set down on the spy pads (see figures 10&11) of a group of 32 strips at a time, i.e. 1-32, 33-64, 65-96 etc. Each probe is connected to a gate in a Keithley 7002 switching mainframe through a cluster of 32 white teflon coated coaxial cables that are solder connected to the edge connector that recieves the probe card. This switching mainframe selects one probe/channel at a time to pass on to the Keithley 487 picoammeter, which then returns to the bias low terminal. The outer conductor of the line from the 7002 to the 487 is also connected to bias low to shield the measured current signal (see figure 10).
This measurement is run by the VI "32 strip I-V points.vi". Initialization is similar to the other VIs. The detector serial number is entered in the proper control. Data mode (append vs. overwrite), and the voltage and current ranges of the Keithley 487 must be selected. Also, the channel range must be selected, i.e. 1-32, 33-64, 65-96 etc., to correspond with the channel range that the probes are connecting to so that the VI can keep track of what data goes with what channel. Figure 11 illustrates our standard numbering scheme for the strips.
The last control is the "Measurement Voltages" array control. This controls the voltages for which the VI stops to make leakage current measurements. While running, the VI steps up the bias voltage in 1V increments, stops at each one, and checks it against the array of measurement voltages. If there is a match, i.e. the user has entered that particular voltage, the VI waits for a number of seconds determined by the "Postvoltage Settling Delay" control, and then goes through each of the 32 gates in the Keithley 7002, waiting for a number of seconds determined by the "Interchannel Settling Delay" control, and makes a leakage current measurement before proceeding on to the next channel. Our standard test voltages are currently 20, 50, and 70 V. The 70V measurement tests the reverse bias breakdown bias voltage specification.
This VI also has a safety feature that immediately stops execution and notifies the user if any one channel draws more than 10 microamps. Should this happen, all data from that run is lost. After all measurements are made (normal execution), the VI ramps the bias down to 0 V and beeps to notify the user that the run has completed. If the run terminates normally, the data is written to a text file. Using Kaleidagraph, the user makes a graph of leakage current vs. channel number with the different bias voltages represented by different symbols. Copies of these graphs are stored in the binders; the raw data files are burned onto CD-ROM and entered in the database along with the date, time, temperature, humidity, and names of those performing the test (see appendix B for details).
XIII. Alpha Source Testing of Depletion Voltage
While the test diode capacitance measurement is supposed to be an accurate indicator of the depletion voltage, and our data do match Micron's reported depletion voltage, further tests done to confirm the accuracy of the capacitance data in determining the depletion voltage show that the detector signal from alpha particles incident on the backplane do not saturate (indicating detector depletion) until between 30 and 40 volts regardless of the capacitance data. So we have decided that two detectors from each delivered batch, those with the highest and lowest depletion voltages reported by Micron and confirmed by our capacitance measurement, will be tested with an alpha source. We expect that this will show signal depletions for both detectors in the 30 to 40 volt range, and therefore we can expect the untested detectors to fall in the same range with reasonable confidence. Further tests would be required should one of the detectors show an unacceptable signal depletion.
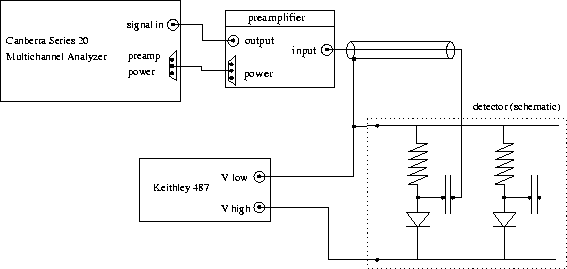
Testing is done by illuminating the back side of a detector with a Californium source (provided by Sangkoo) through a hole in the aluminium and pc board of the mounting jigs. Bias is supplied by a Keithley 487, and the signals are read out with a Canberra Series 20 multichannel analyzer and associated equipment (see figure 12 for a schematic diagram). Signals are collected for some time period, 30 to 200 seconds, at bias voltages from 10 to 70V in 10V steps. Additional voltages may be done if necessary. The created distribution should show a gaussian noise pedestal, with a flattish signal edge extending out and ending near vertically. When the signal distribution stops extending with increasing bias, the detector is depleted. After the run completes, the screen display is photographed with the digital camera and the pictures saved on CD-ROM. After examining this and the CV data, the depletion voltage is determined for the entire batch of detectors by Sangkoo Hahn. This data is then entered in the database along with the date, time, temperature, humidity, and names of those performing the test (see appendix B for details).
XIV. Grade Assignment
Final grade assignment is a somewhat subjective process. Detectors that pass all specs are of course given "A" grades. Marginal detectors may be assigned "A" grades at Sangkoo Hahn's discretion. All other detectors are given a nominal "J" (junk) grade, except those with low interstrip resistance which are automatically and irrevocably graded as "J". "B" grade detectors are determined by need. If an detector is needed for testing other parts of the subsystem, a suitable "J" grade detector can be promoted to "B" and used. Examples include glue compatibility testing, jig testing, and possibly FEE testing.
Appendix A: Detector Specifications, Physical and Electrical
Appendix B: The Silicon Strip Detector Database