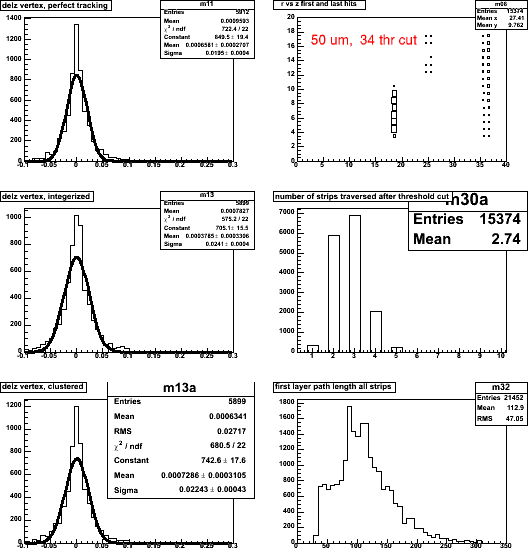
In these plots, the z-resolution is determined by connectin points
in the first and last planes hit, and finding the z-intercept. Events vertices are thrown
between z=+-10cm. Top right shows the first and last hits in the r-z plane. Note the last plane
is now at 36 cm.
The plots in the left column show the z-resolution under various conditions.
- top: perfect tracking
- positions 'integerized' according to the strip width
- positions derived from hit strip clusters.
If an ADC threshold cut is made, it can remove strips from a cluster, the first
or the last cluster member, or both. The right middle plot shows the cluster size after the
threshold cut, and the bottom left plot also is after the threshold cut.
Analysis: resolution_both.C
Plots: res_cluster_both.C
|  Input: ancsvx_softlink.root -> ancsvx_143a-e.root
|
 Input: ancsvx_softlink.root -> ancsvx_143a-e.root

