|
-
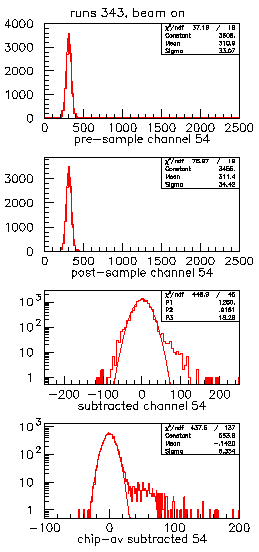
The distribution of samples taken just before a triggered event, the
so-called pre-samples.
-
The distribution of samples taken just after a triggered event. or
post-samples.
The real signal is of course in the subtraction of (1) from (2), which is shown in
the third plot.
-
The 'single-difference' distribution. Note that normally, whe you
subtract two numbers from each other, the width of the resultant
distribution (3) should be 1.4 x the width of the originals (1) and (2).
However, the width of the pre- and post-samples was 34 channels, while the
sigma of this single difference is 18 channels. This shows that there is
low-frequency noise (slow on the scale of the sampling frequency) that is
removed by the subtraction.
The signal, which is expected around channel 50-60, is still mostly
buried in the very wide pedestal.
We had noticed that the signals seemed to bounce up and down in groups of
8 (corresponding to presumably an 8-channel preamp, amu or adc chip on
the boards). By calculating the average of a group of 8 channels, and
subtracting this average from each of the channels in this group, this
chip-wide noise was removed, as shown in the 4th plot:
-
The 'double-subtracted' distribution. The width is reduced from 18 to 8
channels, and the signal is now clearly visible, although still not
cleanly separated from the pedestal.
The remaining width is blamed on the behavior of the current version of
the ADC chip, as detailed on the next slide.
|

![[Up]](arrow.marble.up.gif)
![[Next]](arrow.marble.right.gif)

![[Up]](arrow.marble.up.gif)
![[Next]](arrow.marble.right.gif)

