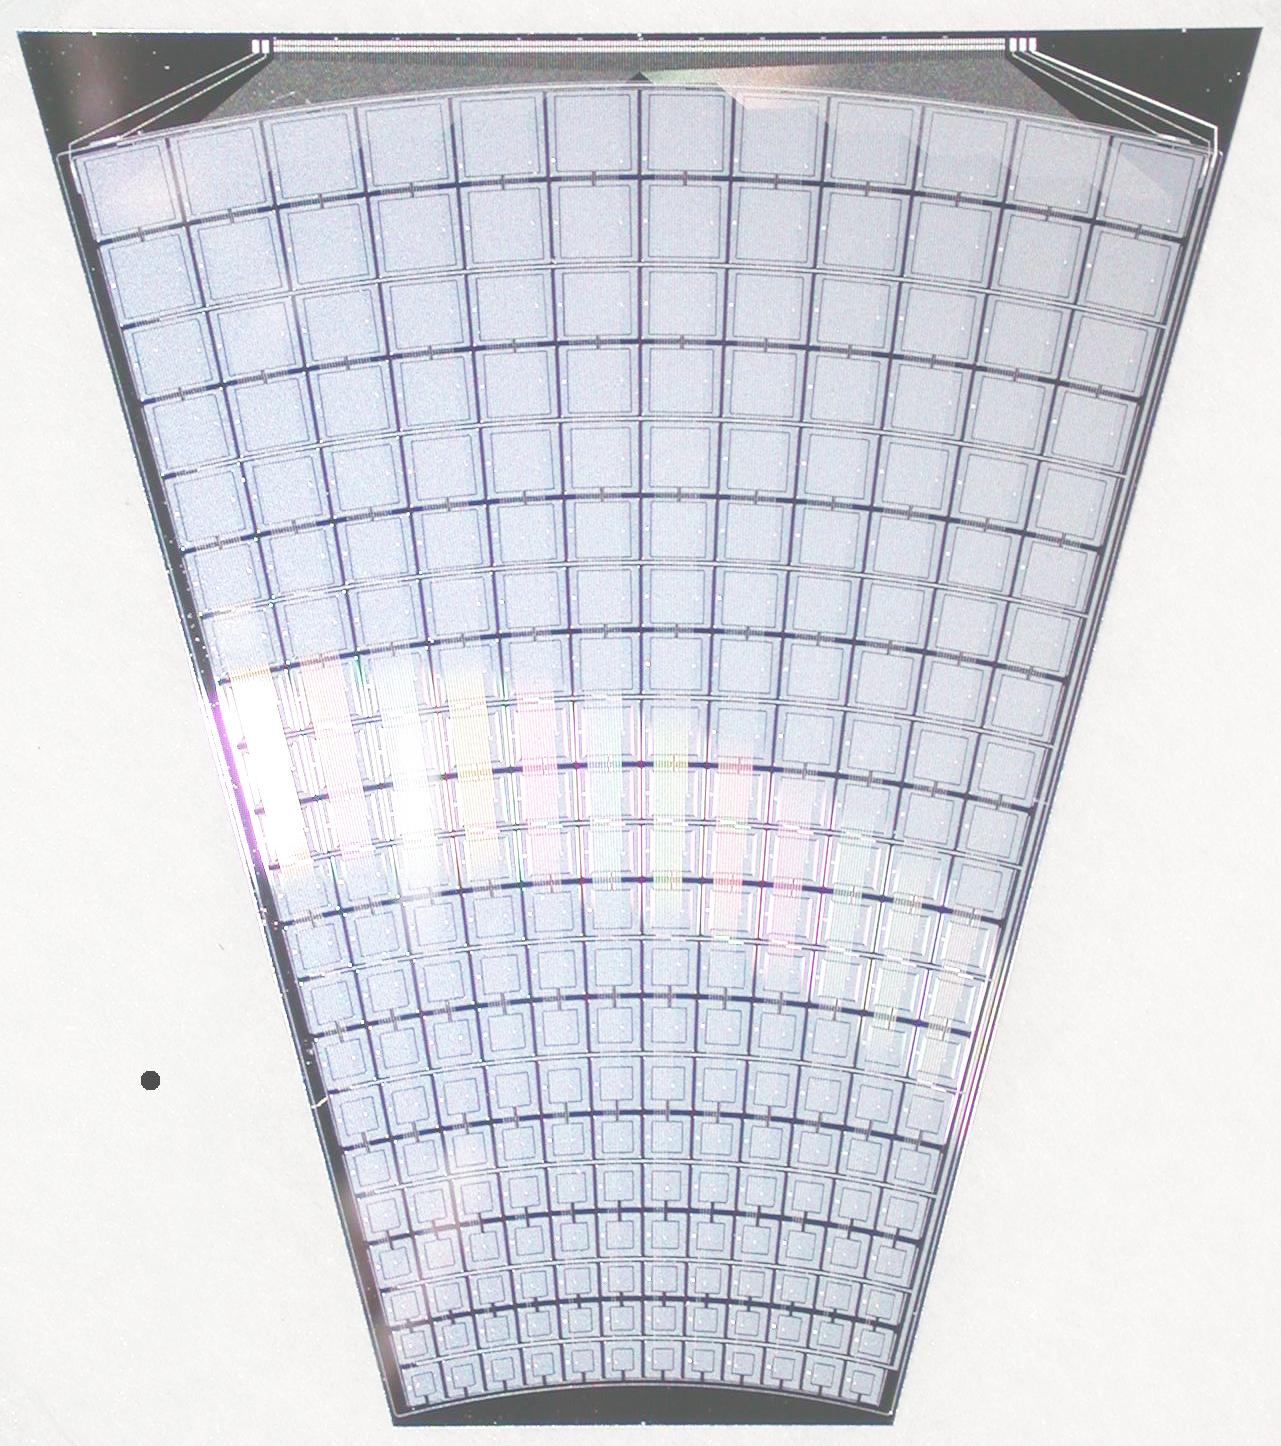
The full pad detector photo is here, and
another one.
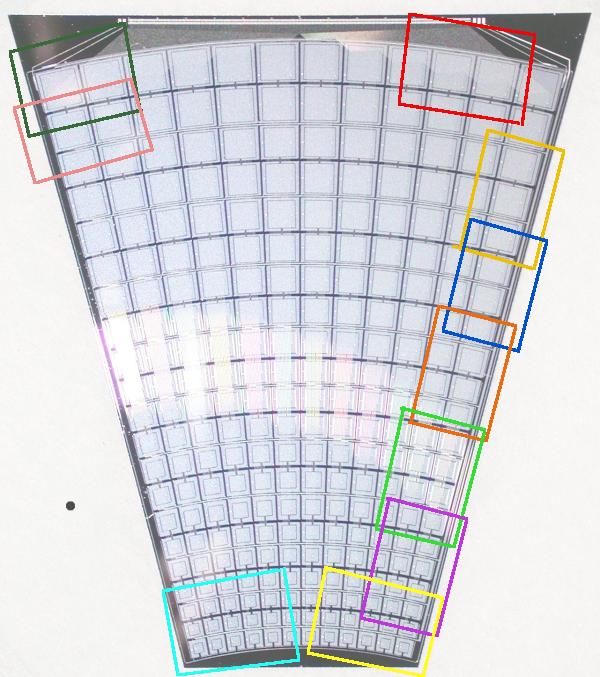
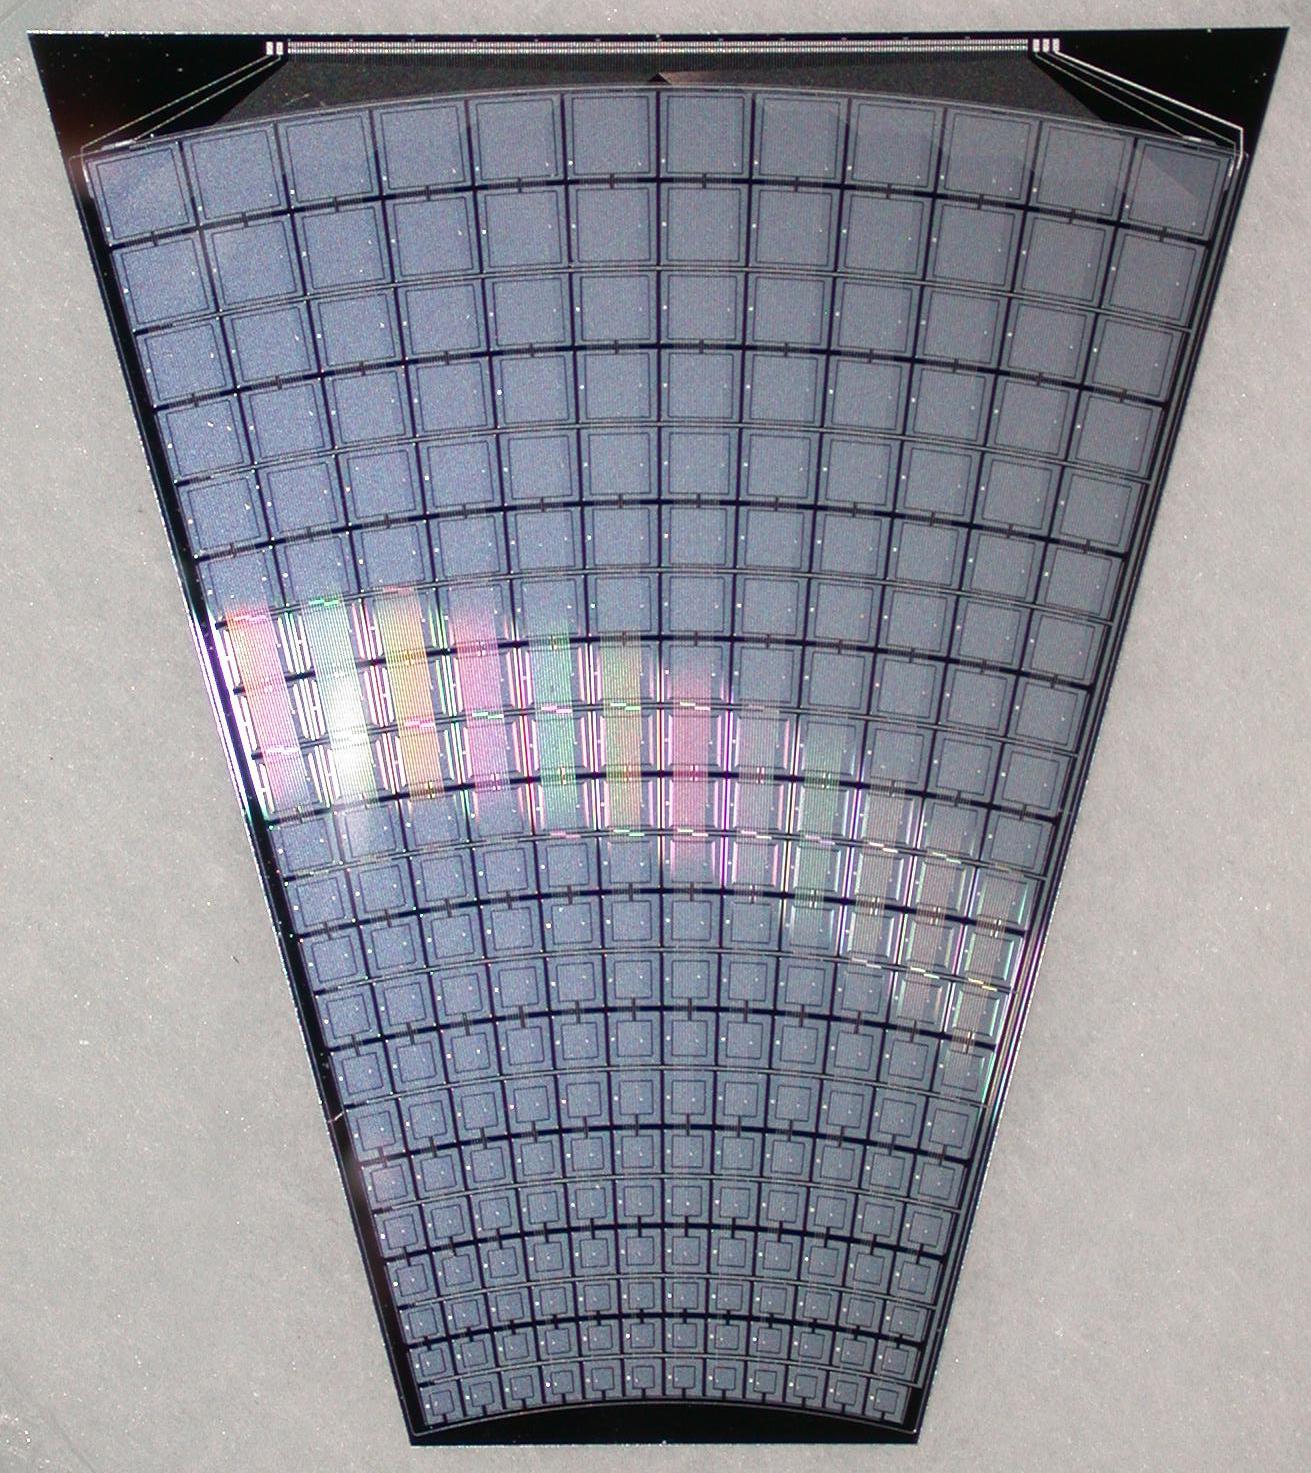
The areas marked on the (smaller) photo below show where
I took micrographs. These are in the table below.
In the table below, images correspond to rectangles outlined in the picture above. Click on them to get the full size.
| ||||||||||||||||||||||||||||||||||||||||||||
with an explanation on this page
|
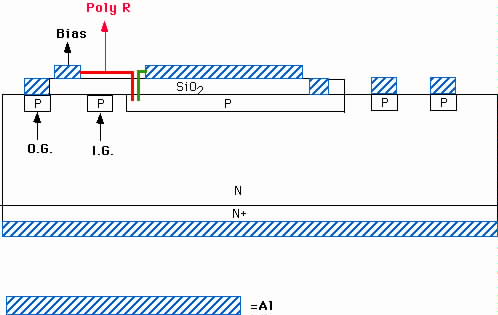
Note that the signals fall off at <70 and >230, where the IR beam is intercepted by the Aluminum readout trace. The area of the dip represents a 1% loss. |
| 
|
|
with an explanation
on this page. Here is
the original postscript file
The ps file is 209095 lines long, and I edited it down to 1930 lines, so
that only 21 pads along the center line are drawn. The boundaries of the pads
in phi are arcs, and along r are straight lines. The corners are rounded.
Thus each pad is made from 42-136 line segments. Here is a link to this
single-row file.
|
|
     --------drawing--------   -----software----
pad   r1     r2   phi1  phi2      r3    r4  dphir
-------------------------------------------------
 1   26.2   46.2  20.4  21.0    5.25   5.45  2.4
 2   46.2   66.4  21.4  21.9    5.45   5.65  2.4
 3   66.4   86.4  22.3  22.9    5.65   5.85  2.4
 4   86.4  111.5  23.2  24.0    5.85   6.10  2.4
 5  111.5  136.5  24.2  25.0    6.10   6.35  2.4
 6  136.5  161.5  25.3  26.2    6.35   6.60  2.4
 7  161.5  191.8  26.6  27.5    6.60   6.90  2.4
 8  191.8  221.9  27.9  28.7    6.90   7.20  2.4
 9  221.9  252.0  29.0  30.0    7.20   7.50  2.4
10  252.0  282.1  30.4  31.4    7.50   7.80  2.4
11  282.1  312.2  31.8  32.8    7.80   8.10  2.4
12  312.2  342.7  33.1  34.1    8.10   8.40  2.4
13  342.7  377.9  34.5  35.6    8.40   8.75  2.4
14  377.9  413.0  36.0  37.0    8.75   9.10  2.4
15  413.0  447.9  37.6  38.6    9.10   9.45  2.4
16  447.9  483.2  39.0  40.3    9.45   9.80  2.4
17  483.2  523.2  40.7  42.1    9.80  10.20  2.4
18  523.2  563.5  42.4  43.8   10.20  10.60  2.4
19  563.5  603.6  44.1  45.6   10.60  11.00  2.4
20  603.6  649.0  46.0  47.6   11.00  11.45  2.4
21  649.0  694.1  47.9  49.6   11.45  11.90  2.4
------------------------------------------------
Column 1 is the pad number from the inside out. Col 2 is the bottom of the
(red) pad relative to the top of the red boundary line, in mm. Column 3 is
copied from the previous one, shifted by 1.
The next column
is the width of the pad at the inner radius, and the 5th column is the width
at the outer radius. This is the 'active width', from the left side of one
pad to the left side of the next pad.
Note that since the measured numbers are from a x10 drawing, and inner cut line is at 50.0mm from the z-axis, the following relation should hold:
 Using the numbers in the table I plot the ratio of areas. Note that there is a
slope to the ratio. This is due to the fact that the assumed dphi3=2.4°
implies a smaller gap between pads on the inside than on the outside.
Using the numbers in the table I plot the ratio of areas. Note that there is a
slope to the ratio. This is due to the fact that the assumed dphi3=2.4°
implies a smaller gap between pads on the inside than on the outside.
The error bars are now correct, and the total effect is now about 7.5%. |
pad    r1       r2     phi_eff
-------------------------------
 1    5.252    5.452   2.216038
 2    5.452    5.654   2.233846
 3    5.654    5.854   2.250410
 4    5.854    6.105   2.261362
 5    6.105    6.355   2.262403
 6    6.355    6.605   2.276802
 7    6.605    6.908   2.293868
 8    6.908    7.209   2.297191
 9    7.209    7.510   2.296660
10    7.510    7.811   2.311130
11    7.811    8.112   2.324506
12    8.112    8.417   2.329408
13    8.417    8.769   2.337040
14    8.769    9.120   2.338082
15    9.120    9.469   2.348670
16    9.469    9.822   2.355274
17    9.822   10.222   2.366840
18   10.222   10.625   2.369118
19   10.625   11.026   2.373764
20   11.026   11.480   2.382871
21   11.480   11.931   2.386204
-------------------------------