

Diagram of one side, and half of length, of MVD frame. The axial center of the framework is to the right side of the picture. Note silicon panel placement, with entire inner surface covered, bottom outer surface covered, and entire outside of only the two end modules covered.

Picture of a single C-module. A center-type module with a silicon panel only on the base on the outside surfaces is shown. Note coordinate system.
 ). It was assumed that the individual
C-modules were pressed tightly enough together so that they would act as a
single unit. The assumption of a continuous beam also depends on the
assumption that the individual beams running in an axial direction are
cross-connected frequently enough so that they act as a single beam, rather
than individual beams. If they are considered to act as a single beam, then
the combined moment of inertia (
 ) of the individual members about the neutral
axis of the framework may be used to represent the framework as a monolithic
continuous section. The FEA program has a utility which calculates moment of
inertia. The printout of
  values is shown in Appendix 4.

Each module is 53.2 mm long in the axial direction for a total of (12 X 53.2) =
638.4 mm long. An area of 302.83 mm2; Moment of inertia,  = 7.9774 X 10⁵
mm4; length to outermost fiber, c = 84.52 mm; and section modulus ( I / c) =
9,438 mm3 were the section properties obtained for the combined axial
members.
Jan Boissevain of P-25 stated that a fully populated (silicon panels on all three outside surfaces) module weighed 20.2 g., and a partially populated (silicon panel only on the lower outside surface.) weighed 13.5 g. These figures were used as a basis for calculating distributed load. After doing a simple experiment, it was determined that the axial force in the cells would be approximately 1.0 kg (1000 g).
Young's modulus for Rohacell was taken as: 10,082 g / mm2.
Two cases were investigated. Jan Boissevain did an experiment with a foam
frame and aluminum panels replacing the silicon. He stated that the framework
showed "no noticeable difference" when supported on end as opposed to being
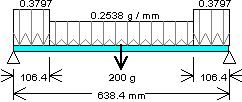
supported horizontally form both ends. He stated that when a 200 g weight was
attached to the middle of framework, an approximately 1 mm (measured with a
ruler) deflection resulted. (He also used a 100 g. weight with a resulting 1/2
mm deflection.)
The two cases were:
A deflection of 0.0675 mm was obtained for the "distributed load only" case; and a deflection of 0.193 mm was obtained for the "distributed load and 200 g center load" case. The first figure "could" be consistent with "no noticeable difference" in the experiment; the second figure varies considerably from the reported 1 mm value.
In the experiment the framework was only loaded at the top of the framework. The corresponding FEA analysis case shows this causes a localized 0.3125 mm deflection at the framework top, with the (unloaded) bottom deflecting only 0.02899 mm. The distortion around the top may account for a significant portion of the additional deflection measured in the experiment. (See "FEA Verification of Deflection") Also, it is speculated that some factor such as slipping of the foam modules against each other may have allowed for a greater deflection to have been measured in the experiment.
A maximum tensile fiber stress of 1.426 g / mm2 was calculated. (compare 227.10 g / mm2 yield) The moment of inertia of a single member at the outermost position was found. A axial force of 132.7 g (compare critical buckling force of 5260 g) was calculated.
Therefore, for the case of deflection due to gravity only, (Hydroscopic expansion is not considered in this calculation.), the conditions are regarded as "benign". However, the effect of hydroscopic expansion is significant and potentially serious. (See Section 5, "Hydroscopic Expansion Analysis").
| FEA CASE | EXPERIMENT RESULTS (mm) | CALCULATION RESULTS (mm) | FEA RESULT (mm) | MAX STRESS (Von Mises) g/mm2 |
|---|---|---|---|---|
| (1) MVDB SILICON PANELS WEIGHT OF PARTS | "No Noticeable Difference" | --- | 0.01610 | 54.58 |
| (2) MVDA SILICON PANELS WEIGHT OF PARTS & 200 g CENTER LOAD | "Approx. 1" | --- | 0.3125 (top) 0.02899 (bot) | 1988.4 |
| (3) MVDC NO PANELS DISTRIBUTED LOAD | --- | 0.0675 | 0.2120 | 38.05 |
| (4) MVDD NO PANELS DISTRIUBTED LOAD & 200 g CENTER LOAD | --- | 0.1934 | 0.9839 | 114.04 |
SUMMARY OF DEFLECTIONS FOR DIFFERENT CASES
Comparing the experimental results to the cases to the FEA cases with the silicon panels attached and the weight of the parts only (1); a firm comparison is difficult to draw. It appears that in either the experiment or the FEA analysis, the case with the weight of the parts only (which is the closest to actual reality) results in small deflections. This forms the basis of the final conclusion.
Comparing the case with weight of the parts plus a 200 g center load added (2); it is difficult to reconcile the difference of the FEA case from the experiment. The fact that the framework was loaded at the top center in the experiment is of some significance, as the FEA analysis clearly shows considerable additional deflection being caused under the area of this localized load. The deflection shown in the FEA analysis (0.3125 mm) does not account for the entire 1.0 mm measured in the experiment, however. It is also possible that during the experiment the foam blocks slipped against each other, or that localized yielding of the foam occurred under the load application point.
Note that the cases with the panels attached to the foam framework (1 & 2), considerably less deflection occurs than in the cases with no panels, but the panel weight distributed into the foam frame (3 & 4). It is apparent that, if firmly attached to the foam frame, the panels provide a considerable stiffening effect and greatly reduce deflection.
It is tempting to reconcile the difference in the experimental case (2), with a 200g center weight, by examining the FEA case (4) with no panels, but the weight of the panels distributed into the foam framework and a 200 g center load. Here a deflection of 0.9839 mm is shown by the FEA case, close to the experimental case (2). In the actual experiment, aluminum panels replaced the silicon panels, and were attached to the foam only with double-sided foam-core tape. This tape would allow considerably more movement than a rigid adhesive. It appears that the aluminum panels added a distributed load to the framework, but were too loosely attached to the foam to add much stiffening effect. It is even possible to carry this hypothesis further and speculate that additional loosening of the panels from the foam may have occurred due to the effects of hydroscopic expansion (See Section 5). In view of the relatively low adhesion of the tape, it appears that these hypotheses may provide a plausible reconciliation with experimental results.
The cases with the 200 g center load are of limited use in predicting performance of the framework, and may not be wholly relevant. Adding additional weight to the center mainly serves as a "proof" test to show that the framework is capable withstanding more than just its own weight, but does not correspond to any commonly occurring situation. It was analyzed herein in order to provide additional comparison and data points, with somewhat limited success. Case (1), with the panels firmly attached and only the weight of the parts loading the assembly, is probably the only analysis that corresponds reasonably well with the reality of normally expected conditions, and is the most useful analysis.
Maximum Stresses for the assembly are acceptable for case (1), probably the preferred case as noted in the preceding paragraph. The tensile strength of Rohacell is 165.3 g/ mm2 (235 psi); and the tensile strength of silicon is estimated as 3516 g/mm2 (500 pgi). A Von Mises stress of 54.58 g / mm2 (77.6 psi) occurs in the silicon panel located on the inside of the assembly, at the ends. Stresses in the foam are even lower. Note this does not include the effect of hydroscopic expansion, which is shown in Section 5 to be of potentially serious consequence.
The case of the 200 g center load with the panels attached (2) shows a stress of 1988 g / mm2 (2827 psi) in the panels underneath the applied load. Even this is not too serious for the silicon, although some local yielding may occur in the foam in this area as well. As noted above, this case may not be particularly relevant.

One side, and half length, of MVD frame. The center of the assembly is to the left, and this half is supported to the right side. View from inside showing VonMises stresses superimposed on X 1000 deflected assembly. Maximum stress is 54.58 g / mm2 (77.61 psi) and is located on the outer surface of the inside silicon panel closest to the supported end, on the edge near the end, and over the silicon / foam junction

X 1000 deflection for Case 1 (MVDB). Silicon panels attached, weight of parts. A deflection of 0.0161 mm occurs at the top corner.

X 100 deflection (note less than previous plot) for Case 2 (MVDA). Silicon panels attached, weight of parts and 200 g center load. The center load is 200 g, but because this is a half section, only 100 g is loaded on it. Note the considerable deflection under the area of the concentrated load, 0.3125 mm. Also note the lower section deflects only 0.02899 mm.

X 100 deflection for case 3 (MVDC). No silicon panels, weight of silicon distributed into framework. A deflection of 0.2120 mm occurs at the upper corner. Note the undulations along the edges of the lengthwise members. This implies that the members may be acting somewhat as separate beams, rather than a single, continuous beam.

X 20 deflection (note less than previous plot) for case 4 (MVDD). No silicon panels, weight of silicon distributed into framework, and 200 g center load. As only half the span is modeled, 100 g is distributed over several points across the right (centerline plane) face. Thus deflection in the upper and lower sections is similar. A deflection of 0.9839 mm occurs at the upper corner.


FOAM
From p. 3-104 Boissevain Handout re foam properties:
71 WF Foam E = 15,435 lb / in2 =

Density given in handout as: 0.075 g / cm3 (slight variation from .071 for 71WF Foam)

Tensile Strength = 235 psi

SILICON
From SSC Silicon Tracking Substation, Miller et al:
Silicon E = 131.0 Gpa
pa: pascal = N / M2 ; Gpa = pa / 109


Tensile strength was not available, however, silicon is somewhat similiar to
glass, which normally has a strength of psi.
psi.

First 2, and last 2, modules:
Fully populated with silicon; 20.2 g.
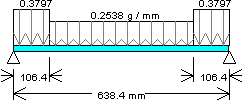
Distributed load = 20.2 / 53.2 = 0.3797 g / mm
8 modules in center:
Partially populated with silicon, 13.5 g
Distributed Load: 13.5 / 53.2 = 0.2538 g / mm
SECTION PROPERTIES OF LENGTHWISE MEMBERS FROM FEA PROGRAM

| BEAM CHART | DISTRIBUTED LOAD |
|---|---|
 | BEAM DIAGRAM |
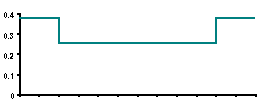 | DISTRIBUTED LOAD W (gm/mm) |
 | SHEAR Max = +94.409 gm Min = -94.409 gm |
 | MOMENT Max = 13, 642 gm - mm |
 | SLOPE Max = +3.41 X 10⁻⁴ rad Min = -3.41 X 10⁻⁴ rad |
 | DEFLECTION Min = -0.0675 mm ( -0.00266 in) |
| BEAM CHART | DISTRIB. & 200 g LOADS |
|---|---|
 | BEAM DIAGRAM |
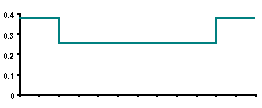 | DISTRIBUTED LOAD W (gm/mm) |
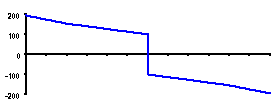 | SHEAR Max = +194.41 gm Min = -194.41 gm |
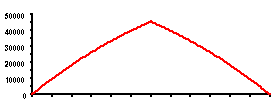 | MOMENT Max = 45, 562 gm - mm |
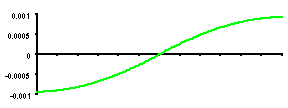 | SLOPE Max = +9.30 X 10⁻⁴ rad Min = -9.30 X 10⁻⁴ rad |
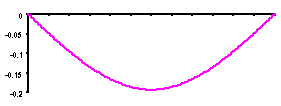 | DEFLECTION Min = -0.193 mm ( -0.00760 in) |
FIBER STRESS
For stress in outer-most fiber at distance C from centerline:

S = (13,463 gm - mm ) (84.52 mm) / (797,740 mm4) = 1.426 (g / mm2)
(Compare 165.3 (g / mm2) Tensile strength
BUCKLING
From Jan Boissevain: Axial force  1.0 kg.
Total area of all horizontal members = 302.83 mm2
Average compressive force = 1000 g / 302.83 mm2 = 3.302 g / mm2
For diagonal outermost beam; from Moment program:
Area = 28.059 mm2
Ibb (About smaller dimension) = 20.844 mm4
Axial compressive stress =
Distributed Compressive stress + Compressive Fiber stress =
3.302 + 1.426 = 4.728 g / mm2 X (28.059 mm2 ) = 132.7 g
Length of unsupported member: L = 41.2 mm
Euler Buckling:
 2 EI / L2
 n = 4 for fixed-fixed case approximated here:
= 4 (3.14159)2 ( 10,852) (20.844) / (41.2)2 = 5260 g
(Compare 132.7 g.)
From FEA progam:
Total volume of legs = (302.83 mm2) X (41.2 mm long) = 12,477 mm3
Total volume of faces = (2) X (1994.7 mm2) X (6.0 mm thick) = 23,936 mm3
Total volume of one module = 36,413 mm3
(This value does not include the volume of the radiuses; which should not add
more
than 1-2% to this value.)
EQUIVILANT DENSITY:
Finding the equivilant density of the foam for the FEA cases in which the mass of the silicon is included within the foam; using the weights of the end and center C-modules:
Group 1 (green), Middle:  1 = (13.5 g) / (36,413 mm3) = 0.0003707 g/mm3
Group 2 ( red ), Ends:  2 = (20.2 g) / (36,413 mm3) = 0.0005547 g/mm3
for a rectangular section:
 = 7.9774 X 105 mm4 ; where: b = base, h = height
define length along face of square: d = b = h
Then:  = 7.9774 X 105 mm4 ; and:
d = 55.624 mm
Volume of a 53.2 mm (length of C-Module) length = (53.2) (55.624)2 = 164,602 mm3
DENSITY: Using the weights of the end and center C-modules:
Group 1 (green), Middle:  1 = (13.5 g) / (164,602 mm3) = 0.00008202
g/mm3
Group 2 ( red ), Ends:  2 = (20.2 g) / (164,602 mm3) = 0.00012272 g/mm3
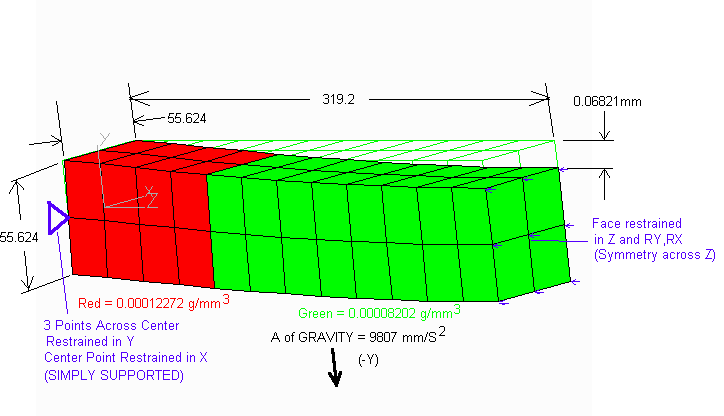
The verification model deflection is 0.06821mm. This is +1.0% greater than the 0.0675 mm value for the distributed load calculation. Considering the relatively coarse mesh in the FEA verification model, this is quite good agreement.
The results of the FEA verification model show that the units and assumptions being used in the main FEA analyses are valid.
' by: R.C. Potter, Group ESA-DE, Los Alamos Nat. Lab., 505-667-1320
' This Version Specifically for PHENIX MVD framework as a continuous beam.
' Program progressively does a trapezoidal integration () of:
' Shear (V) =  Load (W) dX;
' Moment (M) =  Shear(V) dX
' Slope in Radians (S) =  [Moment(M) / EI] dX;
' Deflection (F) =  Slope (S) dX
' After each integration, program applies correction to each variable in
' order to satisfy end conditions. The simply supported case with M=0 at
' either end is used. Program then outputs to a separate file for each
' variable *.W, *.V, *.M, *.S, *.F. These files can be used to make plots.
' Within program, each variable W,V,M,S,F has a variable at the start and
' end point of the integration interval. (example, for dX = 1: V1(1) at
' X=1.0, V2(1) at X=2.0, V1(2) at X=2.0... etc.) In output files, normally
' only the starting point is printed; and both starting and end points are
' only printed out where there is a discontinuity.
'
dX = 3.8 ' Integration Interval, mm
' Section Properties: E=Young's Mod. g/mm^2; I=Mom. of Inertia mm^4
E = 10852
I = 797740
EI = E * I
' Dimension Statement; P1,P2 are printout variables
DIM W1(168), V1(168), M1(168), S1(168), F1(168), P1(168)
DIM W2(168), V2(168), M2(168), S2(168), F2(168), P2(168)
' Enter Output File Name
INPUT "OUTPUT FILE NAME, WITHOUT (.) EXTENSION:", FO$
'
' BEAM LOADING (W)
FOR N% = 0 TO 167
X = N% * dX
'
IF N% < 28 THEN
W1(N%) = .3797
W2(N%) = .3797
END IF
'
IF N% >= 28 AND N% < 140 THEN
W1(N%) = .2538
W2(N%) = .2538
END IF
'
IF N% >= 140 THEN
W1(N%) = .3797
W2(N%) = .3797
END IF
NEXT N%
'
' SHEAR (V)
V1(0) = 0
FOR N% = 0 TO 167
V2(N%) = V1(N%) - (.5 * dX * (W1(N%) + W2(N%)))
V1(N% + 1) = V2(N%)
NEXT N%
' Point Load of 200 g ' * Omit for Case w no 200 g center load
FOR N% = 84 TO 168 ' *
V1(N%) = V1(N%) - 200 ' *
V2(N%) = V2(N%) - 200 ' *
NEXT N% ' *
' Correct Shear to V1(0) = -V1(168), last V = negative of first V
VCOR = (V1(0) - V1(168)) / 2
FOR N% = 0 TO 168
V1(N%) = V1(N%) + VCOR
V2(N%) = V2(N%) + VCOR
NEXT N%
'
' MOMENT (M)
M1(0) = 0
FOR N% = 0 TO 167
M2(N%) = M1(N%) + (.5 * dX * (V1(N%) + V2(N%)))
M1(N% + 1) = M2(N%)
NEXT N%
'
' SLOPE (S - radians)
S1(0) = 0
FOR N% = 0 TO 167
S2(N%) = S1(N%) + (.5 * dX * (M1(N%) + M2(N%)) / EI)
S1(N% + 1) = S2(N%)
NEXT N%
' Set Slope to zero at Center, S1(84)
SCOR = S1(84)
FOR N% = 0 TO 168
S1(N%) = S1(N%) - SCOR
S2(N%) = S2(N%) - SCOR
NEXT N%
'
' DEFLECTION, (F)
F1(0) = 0
FOR N% = 0 TO 167
F2(N%) = F1(N%) + (.5 * dX * (S1(N%) + S2(N%)))
F1(N% + 1) = F2(N%)
NEXT N%
'
'
' PRINT TO FILES
' For Each Plot, NPLOT (W=1, V=2, M=3, S=4, F=5)
FOR NPLOT = 1 TO 5
IF NPLOT = 1 THEN OPEN FO$ + ".W" FOR OUTPUT AS #1
IF NPLOT = 2 THEN OPEN FO$ + ".V" FOR OUTPUT AS #1
IF NPLOT = 3 THEN OPEN FO$ + ".M" FOR OUTPUT AS #1
IF NPLOT = 4 THEN OPEN FO$ + ".S" FOR OUTPUT AS #1
IF NPLOT = 5 THEN OPEN FO$ + ".F" FOR OUTPUT AS #1
' Transfer Each Array into P1 and P2
FOR N% = 0 TO 168
4A-9
IF NPLOT = 1 THEN
P1(N%) = W1(N%): P2(N%) = W2(N%)
END IF
IF NPLOT = 2 THEN
P1(N%) = V1(N%): P2(N%) = V2(N%)
END IF
IF NPLOT = 3 THEN
P1(N%) = M1(N%): P2(N%) = M2(N%)
END IF
IF NPLOT = 4 THEN
P1(N%) = S1(N%): P2(N%) = S2(N%)
END IF
IF NPLOT = 5 THEN
P1(N%) = F1(N%): P2(N%) = F2(N%)
END IF
NEXT N%
' For Each Point N
FOR N% = 0 TO 168
X = N% * dX
' Discontinuity at Boundary of Integration Intervals
IF N% = 0 GOTO NODIS:
IF P2(N% - 1) <> P1(N%) THEN
PRINT #1, USING "###.##"; X;
PRINT #1, CHR$(9);
PRINT #1, USING "##.####^^^^"; P2(N% - 1)
END IF
NODIS:
'
PRINT #1, USING "###.##"; X;
PRINT #1, CHR$(9);
PRINT #1, USING "##.####^^^^"; P1(N%)
NEXT N%
'
CLOSE #1
NEXT NPLOT