|

|

|

|

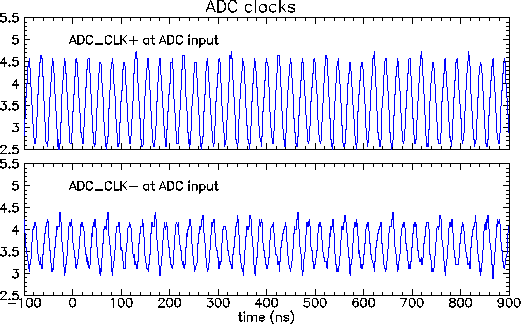
Here is a plot showing the "clock" signals at the ADC input
(there is also a a postscript version).
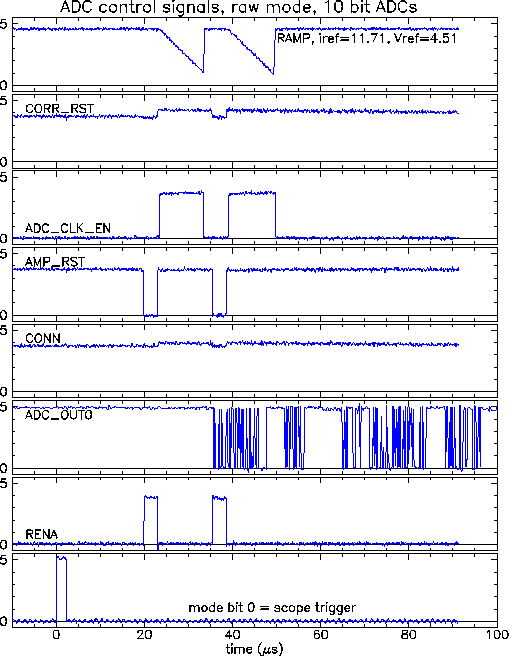
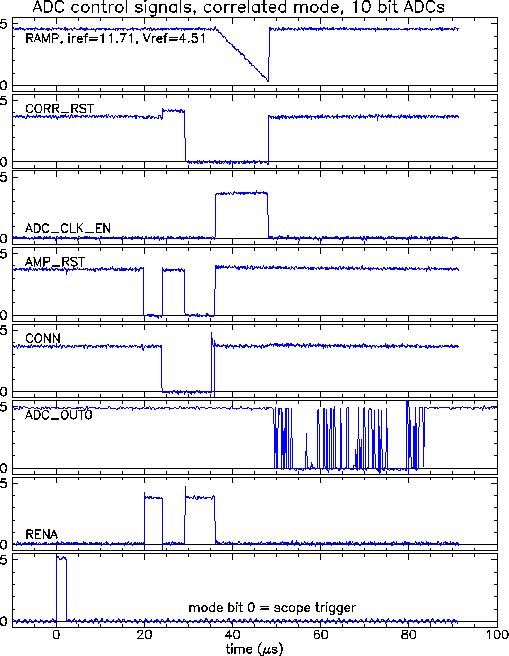
The plot below shows some of the key signals used in the AMU/ADCs. These were all measured using the "bench calibration", which is enabled with mode bit 2 and triggered by mode bit 0. Mode bit 0 was used as the scope trigger for each trace shown.
10 bit digitization was used (SLCT0=0, SLCT1=1) with a 40 mHz 4x clock. The first set of plots was taken with the correlator on (RAW_MODE=0). The picture below is also available as a postscript file.
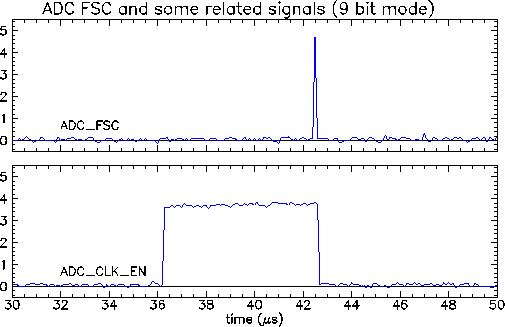
For reasons I do not yet understand, the ADC_CLK_EN pulse (from the heap manager) is not quite long enough to allow the system to count to 10 bits. As a result, in 10 bit mode, the ADC_FSC (ADC full scale count) output is never seen. In 9 bit mode, ADC_CLK_EN is shorter and ADC_FSC is seen. It is very narrow, so a different time scale must be used to see it. It comes just at the end of the ADC_CLK_EN pulse (I believe that it goes to the heap manager and causes the end of ADC_CLK_EN). An example of this is shown below for 9 bit digitization (also available as a postscript file).
On September 9, 1998 Melissa Smith gave us the following simulation
of the expected behavior of some of the ADC control signals. This
simulation has the correlator on (raw_mode=0):

The following plot shows the same set of control signals, but this time the correlator is on (RAW_MODE=1). The picture below is also available as a postscript file.
