In area tocvs5, hijing.dat points to /phenix/data02/rhphemds/events/hjievt_600auaucentsq08_042298.dat
Macros newcode2.C for analysis, auau_1.C and auau_2.C for display.

Take 9 AuAu events, require that at least 3 out of 4 Si endcap planes are hit, and project the surviving tracks out to z=+180 cm (North station 1). Left panel is the number of layers hit on the North side. Half of tracks are zero (going to the South, and of the rest, most hit 4 layers.

Right panel shows the first hit layer (out of 3 or 4)

Left: x-y distribution of first hits.

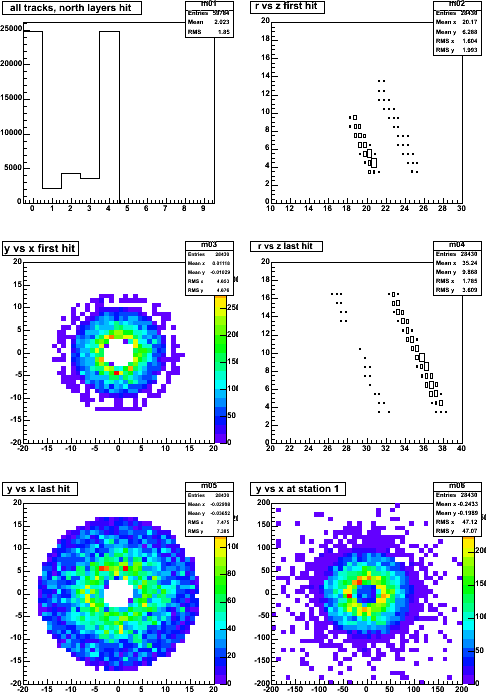
Right: r-z of last hit layer

Left: x-y of last hit layer hit

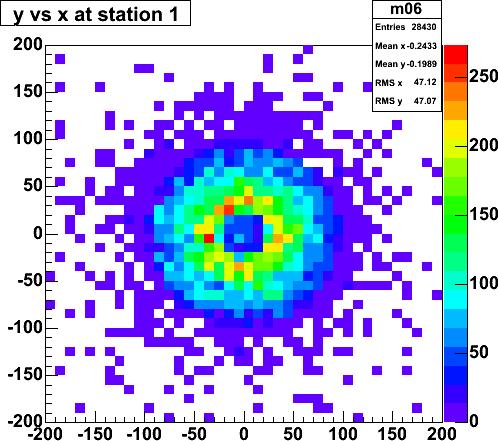
Right: Projection of tracklets onto a plane at z=180 cm (=North muon station 1). There are a few bins (red) with 250 entries, which translates into 250/9=28 per bin of 100 cm^2, which is 3.6 cm^2 per track, which corresponds to a circle of 2.2 cm diameter per track.

Large formats: png,   jpg,   gif,  

Note that the density seems high.
Left: r in the plane of station 1. The left (25 cm) and right (95 cm) edges correspond to eta = 2.67 and 1.40 respectively.

Right: superposition of the previous r-z plots, with (0,0,0) on the left bottom. Why can't I draw a line through the origin and the layer corners?

Left: slice from xy distribution from above.

The Phobos dn/deta for central AuAu has a plateau at a bit over 600/unit, and only falls off a little by eta=2.67. Therefore we expect to see 600×1.27=762 particle. We see 28430/9 = 3159 tracks per event, which is 4× the phobos number.