|
![[Up]](arrow.marble.up.gif)
|
![[Next]](arrow.marble.right.gif)
Previous slide
| Up to slide index
| Next slide
| |

|
![[Up]](arrow.marble.up.gif)
|
![[Next]](arrow.marble.right.gif)
Previous slide
| Up to slide index
| Next slide
| |
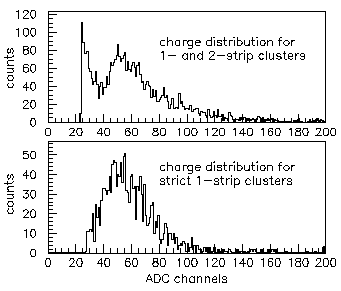
Below is a pair of plots showing Landau distributions of selected signals.
The first plot contains 1-strip clusters, where one strip had a signal greater than 2.5x the pedestal sigma, as well as 2-strip clusters, where two neighboring strips had signals greater than 2x the pedestal sigma. In addition, a coincidence with a signal on the downstream silicon detector was required. It shows the expected landau distribution of the deposited charge, as well as the upper edge of the pedestal (which is centered at 0.0 by the subtractions).
In the second plot, entries are made only if a signal exceeded 2.5x the pedestal sigma, and if neighboring strips were lower than 1.5x pedestal sigma. In addition, a downstream coincidence (with the other silicon detector) was required. This ensures that only min-i, non-charge-sharing signals are collected. A nice Landau is seen.
Signal-to-noise, derived from this last distribution, is about 6:1.
