|
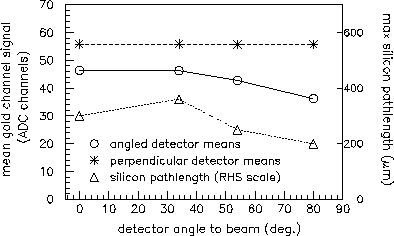
Incident Angles: For several beam
runs, the downstream detector was
set to some angle relative to the
beam, with the upstream detector
left perpendicular. The mean
signal was calculated for each of
four different incident angles,
normalized, and plotted. For
comparison, the normalized signal
was also plotted for the
perpendicular detector in the same
column as the corresponding angled
detector data. In addition, the
maximum silicon path length
through each `cell' was calculated
and plotted (right hand scale).
This `cell' is the active region
for each strip, 200 by 300 microns
(strip pitch by detector thickness).
|

