Figure 1: The Multiplicity Vertex Detector.

Figure 2: Drawing of the C--cage structural unit. Silicon wafers are glued to the faces of the cage.
This drawing also shows the location of the various
widths, radial distances and lengths that were measured in the lab tests.

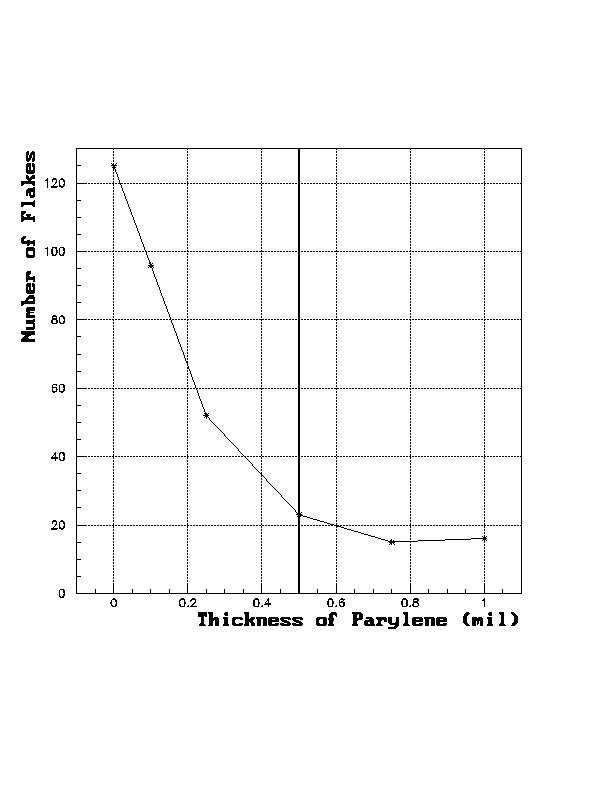
Figure 3: Results of robustness on Parylene coated Rohacell
strips. Graph is showing Thickness of Parylene vs. Number of flakes that have
detached from the Rohacell strip.

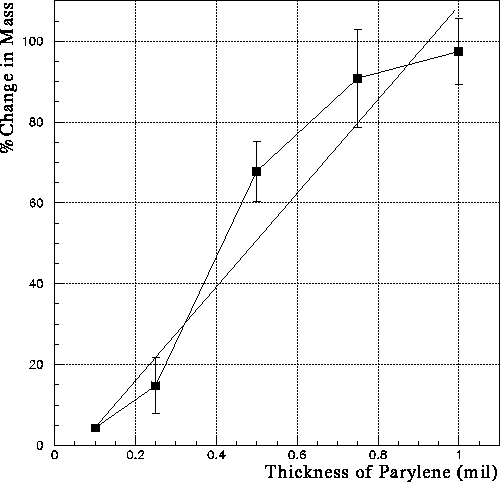
Figure 4: Average change in mass vs. thickness of parylene coating.

Figure 5: A partially populated (4 silicon wafers) C--cage assembly with
corresponding electronics. The silicon wafers are attached to the electronics
via a kapton cable and the electronics are housed in a Rohacell air cooling
plenum. A fully populated (6 silicon wafers) has all six faces populated with
silicon and two more electronic boards in the plenum.

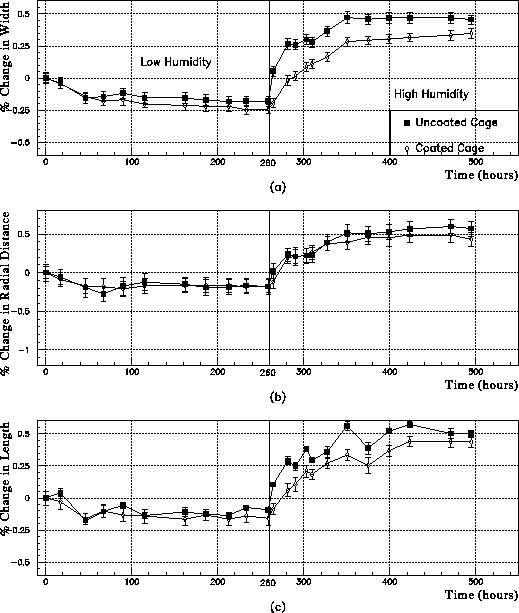
Figure 6: Shows the changes in the widths, radial distances, and length for
bare (no silicon wafers) coated and uncoated cages. (a)Shows the average
change in widths for bare uncoated and coated cages, (b) for radial
distances and (c) for length. All errors are statistical.

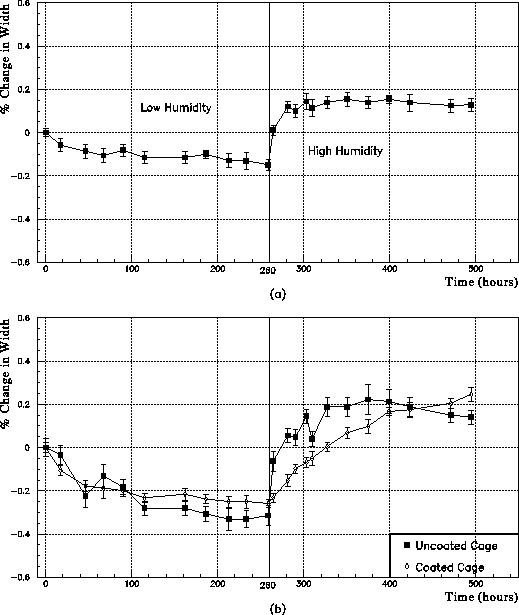
Figure 7: Shows (a)the avenge change in width for a six-silicon cage
without Parylene, (b) the changes in length for an uncoated and coated
six-silicon cage. All errors are statistical.
![]()
Figure 8: Shows (a) changes in width with and without silicon for a
four-silicon cage, (b) shows the change in length for a four and a
six-silicon cage. All errors are statistical.