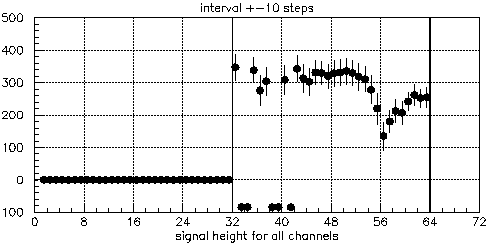
This summary plot shows the mean signal height as a function of channel number.
These are the means of the gaussians fit to the signals fished out of the scan
plots.
Dead channels show up at -99. The signal for non-dead channels is around 330,
but falls to 220 across the 3rd chip, and in the 4th chip, rises from 140 to
260:

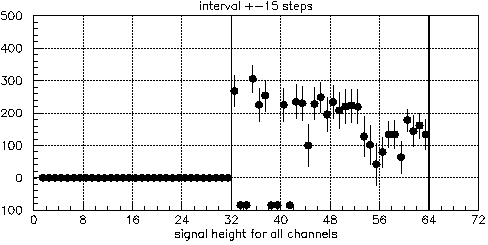
If you make the 'signal window' too wide (+-15 steps), you start picking up
pedestals, and the fits go down:

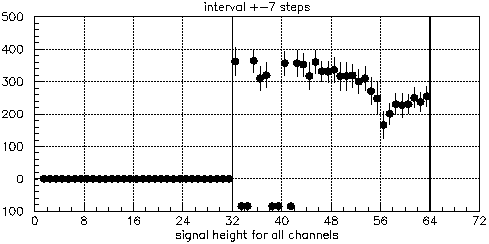
A window of 7 is almost indistinguishable from a window of 10:

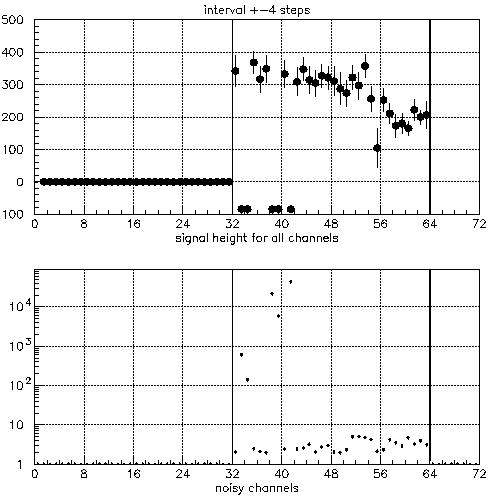
As the window becomes too narrow (+-4 steps), you run out of statistics. The width is plotted in the lower figure. Apart from the dead channels, no strong trends (such as edge-effects at the chip boundaries) can be seen:
