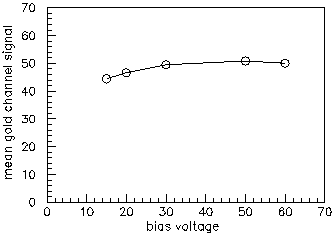
The figure below shows the dependence of the signal on bias voltage. It shows qualitatively the right behavior, where the signal rises from 0 to saturation at around 20-30V.

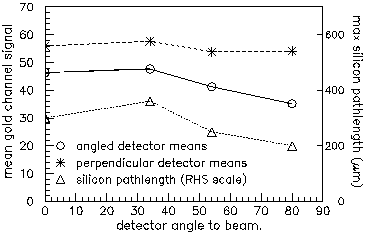
The data in the figure below were collected by rotating one of the detectors to 3 different angles relative to the normal.
