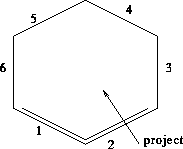
To find the x-y position of the vertex, I draw a plane perpendicular to the z-axis, at the at the location of the found z-vertex. Then I play the same game as for the z-vertex pseudo-tracking: connect all inner-outer hits and project to the plane, where I look for the maximum.
|
|
Each of the 6 phi-sectors can make a projection along a line
perpendicular to the plane of the silicon. Note that sectors 1 and 2 are
fully populated with silicon panels, and sectors 3-6 only on the outer
ends. |
|
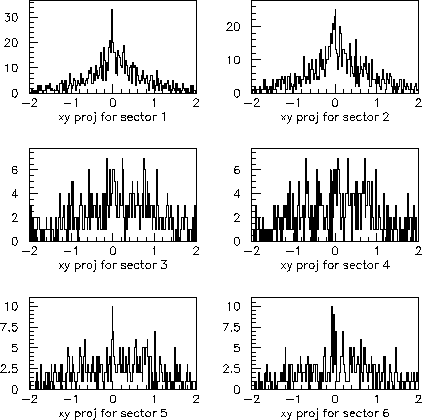
These are the projections made by each of the 6 phi-sectors along a line
perpendicular to the silicon planes. The data are for a single AuAu collision.
The x-axes are in cm, with the origin
sitting at the crossing with the z-axis. The peak at 0 can be picked out
easily in sectors 1 and 2, but it is less unambiguous for the partially
populated sectors 3-6.
|
|
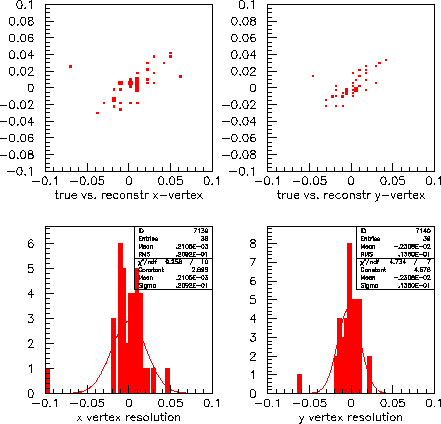
In the top two scatterplots, the calculated position is plotted on the
x-axis and the true position on the y-axis, (x on the left, y on the right)
for about 40 events. A good correlation can be seen. The bottom two plots are
the diagonal projections, or (calculated-true).
These projections show that x and y of a single AuAu event vertex can be located to a few hundred microns. |
|
|
|
| Previous page
| Up to the index
| Next page
| |