|

|

|

|
MVD signal-to-noise tests
Sangkoo Hahn, Younggook Kim, John Sullivan
Note: this work is still in progress
These tests were done with a 106Ru beta- source and the MVD chaintest setup. This means the DAQ chain was "real" starting at a Si strip detector through to a DCM -- which wrote a Phenix Raw Data Format (PRDF) file on the disk. We analyzed the PRDF file with our own standalone software. For more details on the chaintest hardware, look here.
In this series of tests, a 106Ru source was put through a Si strip detector. The level-1 trigger came from a scintillator behind the detector. The scintillator is about 22mm * 22mm and is about 5cm from the Si. The (disk-shaped) source was about 3 cm from the Si.
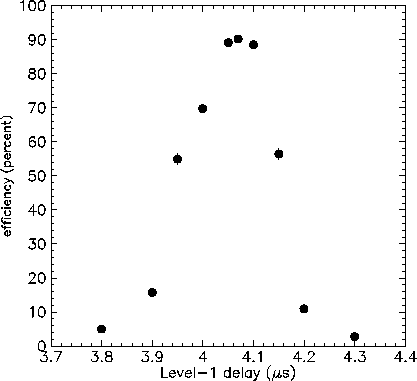
The first plot (shown below and also available as a postscript file) shows the "efficiency" as a function of te level-1 timing delay. "Efficiency" is defined below, this plot is intended to show that the level-1 delay was set correctly. Since the pre and post samples are 200 ns apart (we run with the correlator on), we expect to see a peak about 200 ns wide -- which we do. We set the level-1 delay at 4.07 microseconds.

The biggest problem we had was noise which was common to all channels. The intersting characteristic of this noise was that it seem to be in phase for all channels. That is, all 256 detector channels would fluctuate (with a typical sigma of 2-3 ADC channels) together. For example, if channel 1 was 2 ADC channels higher than normal, all 255 other ADC channels in the system would be about 2 channels higher than normal. I suspect that this is caused by AC noise at a few mV level (1mV = approximately 1 ADC channel with our current parameters) on the AMU output to the ADC. In correlated mode, AC noise on the AMU output line will not be removed.
To solve this problem, we made an event by event correction as follows:
1) For each event i, calculate the average of all 256 ADCs in the event
(i.e. from each of 256 channels on the MCM). Call this quantity A(i).
Units of A(i) are ADC channels.
2) For all events in the run, make a histogram of A(i).
3) Calculate the mean value of this histogram = A_avg (units are ADC channels)
4) In a second pass for each run, make an event-by-event correction
by adding the quantity A_avg-A(i) to each ADC (i.e all 256 of them)
in the event.
This correction is probably not possible in the real detector because
of the high occupancy of the strip detectors in central events.
However, we hope it is caused by AC noise as described above -- in that
case it could be fixed by
1) better shielding and grounding (which we are working on)
2) running without the correlator and taking two samples per
channel (we will test this soon)
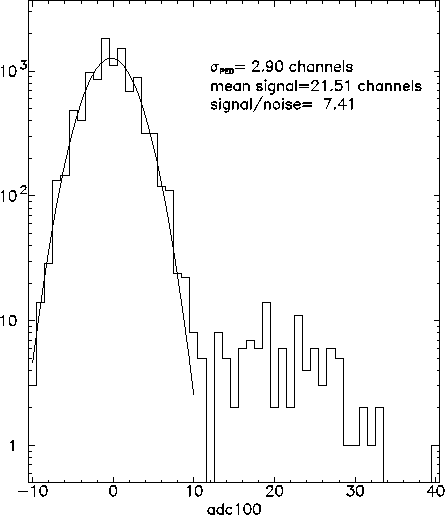
The plot (also available in postscript) below shows the signal to noise for a sample channel without this event-by-event correction:

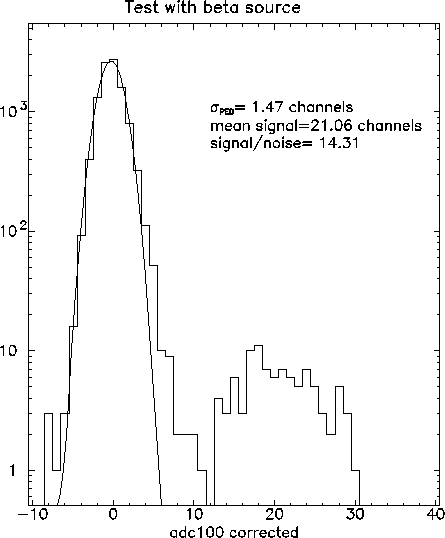
The following plot (also available in postscript) shows the same sample channel with the event-by-event correction.

The small number of counts in the signal compared to the pedestal (about 100/1 ratio) is because the scintillator is big (22 mm wide means 110 strips wide) so the trigger selects a range of about 100 strips. When I plot only one channel as in this case, most counts are in the pedestal.
The signal-to-noise ratio is defined as (sigma of the pedestal from a gaussian fit)/(mean ADC value for the beta source which is about 1 mip). The specification for the MVD is 10/1. Simulations have shown that the performance is probably acceptable about 6/1. Without the event-by-event correction the are better than 6/1 but not up to spec. With the correction, we are well above the spec.
We are still working on this problem.