|

|

|

|
Tests of discriminator on first MCM
Sangkoo Hahn, John Sullivan
Some tests of discriminator performance on the first MCM were done. The plots below summarize some of the results.
Since then, Sangkoo has done a much more complete study of discriminator performance. It is not on the web now. These results are therefore somewhat out-of-date, but are useful for understanding shapes of waveforms, etc. The data in this document were last updated 14-May-99.
All tests were done using the calibration charge injection which is build into the TGV discriminator/preamp chips. We are still working on noise reduction and hope to improve these results.
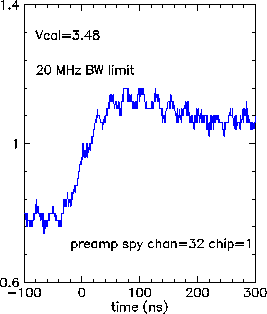
The plot below shows the captured scope trace for the pre-amp spy channel. The spy channel was set to look at the 32nd (last) channel of the first (of 8 total) chips on the MCM. The scope was triggered on this trace. All of the other plots below were triggered on this same trace. Because the other traces were captured at different times, there are small (10 ns level) variations in the location of t=0 (=time of trigger) on the various plots.
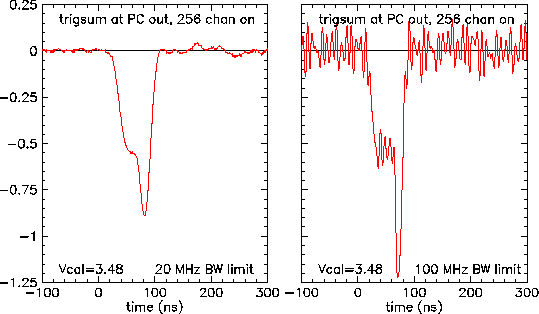
The plot below shows the trigger sum output signal when all MCM channels (256 total) were "on" with their amplitude set to the maximum possible. This means the Vcal DAC is set at 3.48. The thresh discriminator was set to 0.5 (another DAC) for all channels. All "tweak" bits were zero. The difference between the two plots is the band width limit used on the scope when acquiring the waveforms. These plots were taken at the output of the "buffer" on the power comm board which drives the output signal.
The plot below is similar to the ones above except that
1) only the 100 MHz band width is shown
2) This trace taken at the end of the cable out of the motherboard --
i.e. the cable that would go to the trigger interface module. This is
a lot uglier than the traces above. We need to work on the reason for this
since there are only passive components and cables between the two locations.

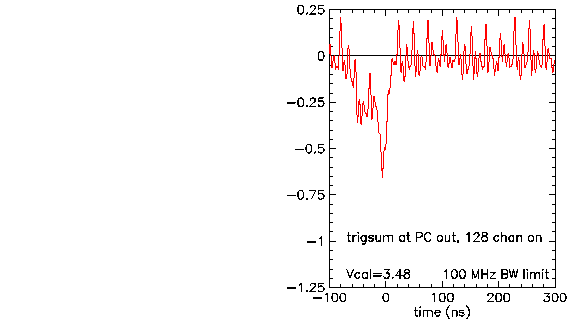
The following plot is again taken at the power/comm board. In this case, only half of the channels on the MCM are "on" (i.e. 128 channels are on). Again, only the plot for the 100 MHz band width is shown. Clearly, the signal amplitude is at least approximately proportional to the number of channels "on".
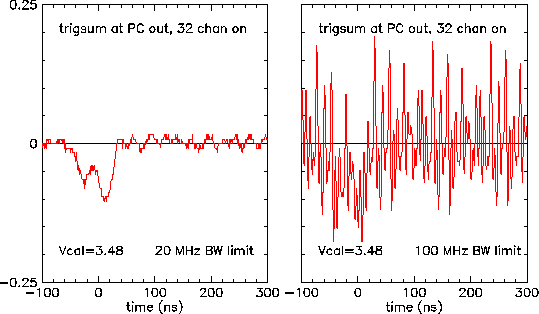
The following pairs of plots are both taken with 32 channels "on" in the MCM. The two plots show 20 and 100 MHz band width. Notice that the vertical scale is different in this case.
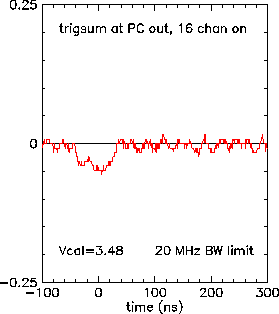
In the follow plot (for 20 MHz only) 16 channels were "on" in the MVD.
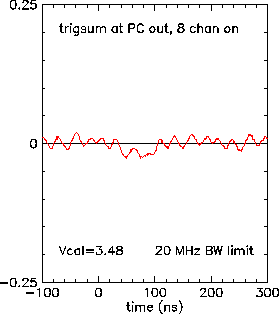
In the follow plot (for 20 MHz only) 8 channels were "on" in the MVD. It seems clear that we need to clean up our noise problems to go to thresholds this low or lower.
