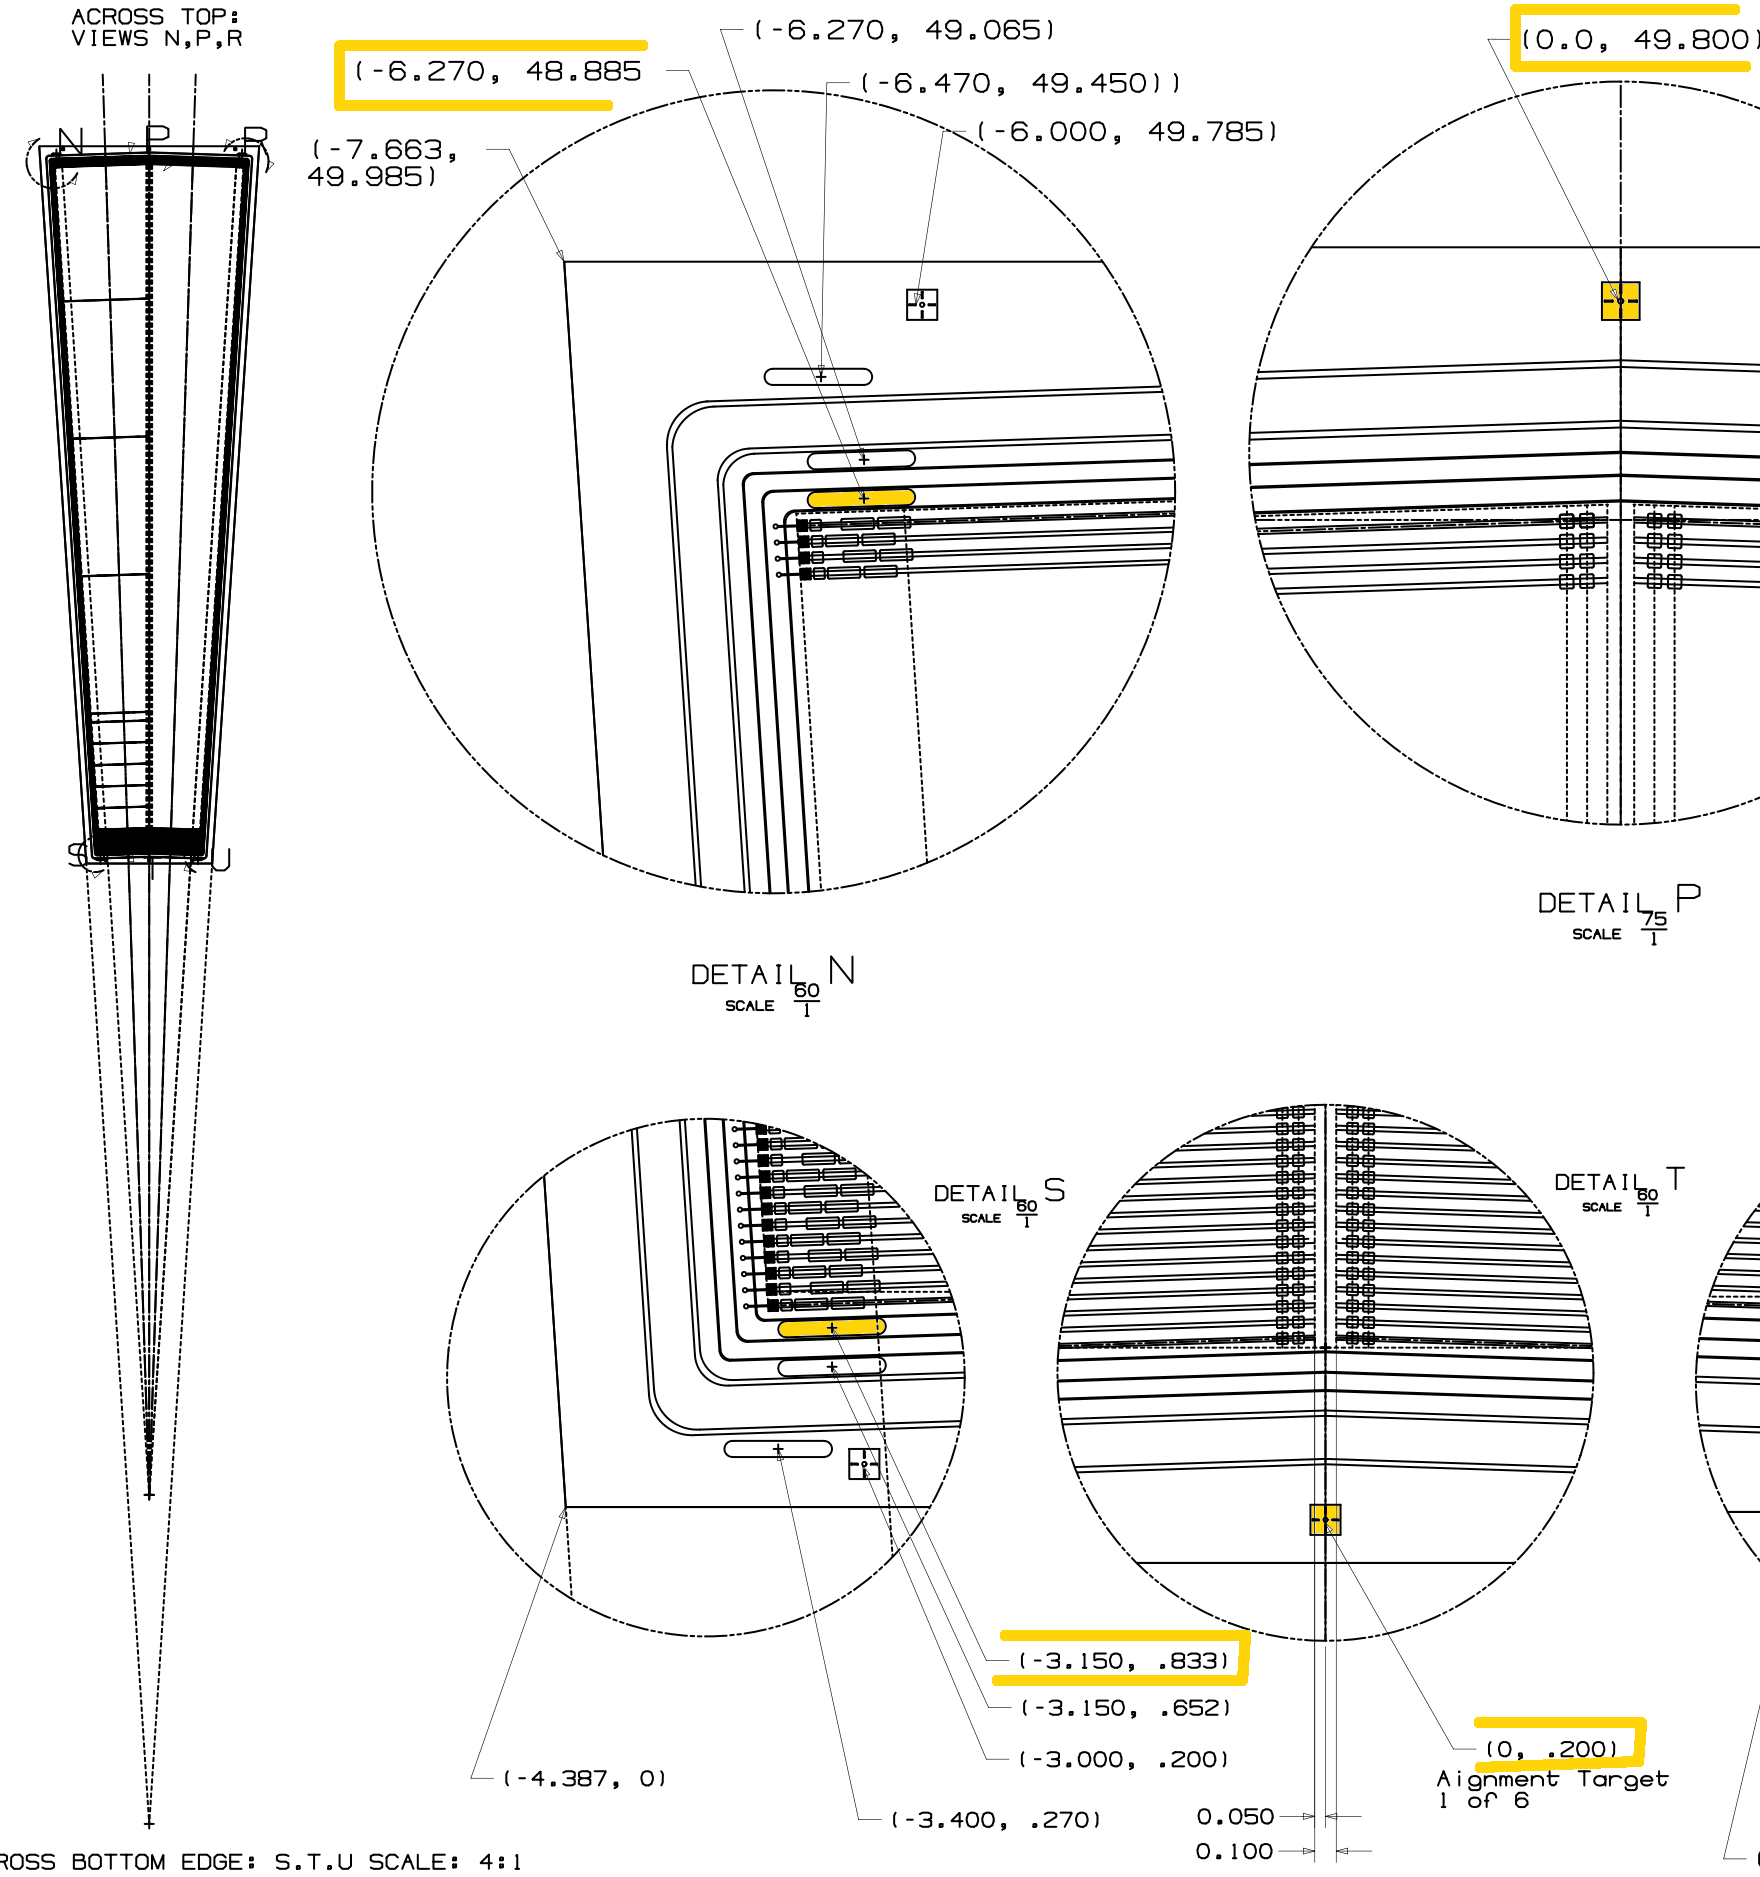
Drawing is from here
Coordinates are from the bottom center of the silicon. In the
(Geant3 and offline) software,
the object of interest is volume SISI, which describes one column of
strips, one on the left and one on the right of the center line.
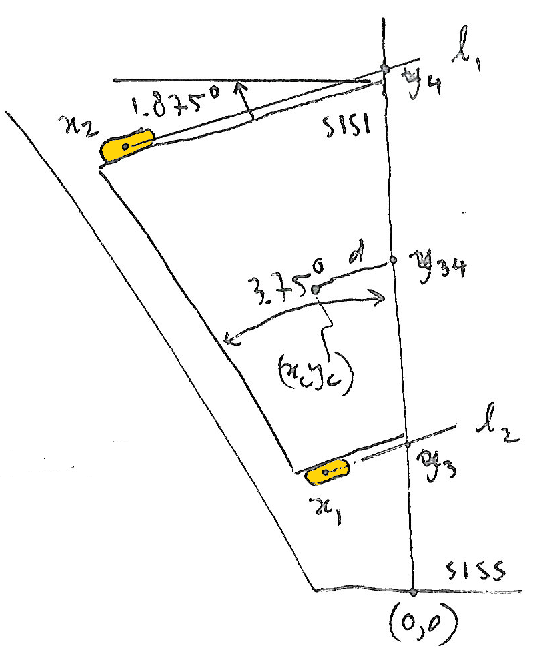
This column is bounded by the oval pads indicated in yellow. From there, we
can calculate the center point of each volume SISI, and then calculate the
location of this centerpoint to the measured fiducial marks, the 2 indicated squares on the center line.
Angles and lengths not to scale. Use this script to calculate (xc,yc)
Center of sisi: ( +- 2.506, 24.931 ) mm(relative to the bottom edge of the silicon). The (small) silicon length in Pisa is now set to 50.00mm (note in the spec document it is 50.06 mm 'cut line to cut line'. In the mechanical pdf (see above), it is 49.985 mm, for a presumed saw blade width of 0.075 mm.
Because of this, if we place SISI at -0.069 mm in SISS, the silicon may be a hair long, but the correspondence between the fiducial marks and the strip positions is correct.
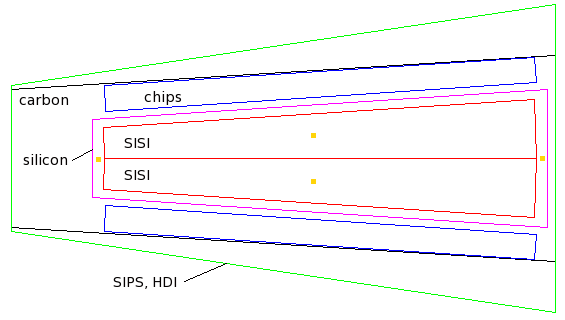
When we want to move the silicon based on the measurements of the two fiducial marks (yellow dots on the center line), we want to move the entire module (volume SIPS), not just the strips SISI.
I ran Steve's root macro, with commands as folows:
.L diskMetro.C
diskmetro *str1 = new  diskmetro(0);
st1->showdesign();
st1->guidata("Station1-NorthWest");
         use rotation angle 3.17
st1->dofits();
st1->printraw();
st1->printcsv();
The angles I used for the 4 quadrants were:
NorthWest   3.17
Northeast   0.025
SouthEast   3.17
Southwest   0.03
I collected the outputs into file Station1_all.csv.
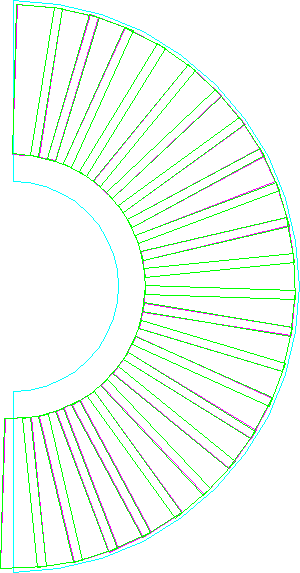
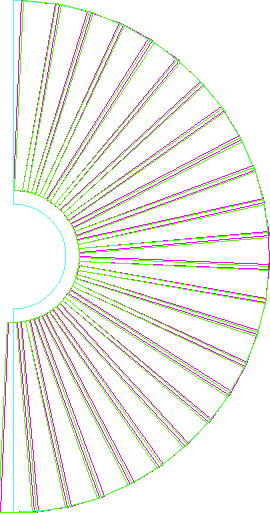
The numbers were read in from this file to Pisa, and the wedges are placed accordingly. What the picture on the right (SI11, which is SW) shows is an overlay of the ideal wedge positions in magenta, and in green the new positions according to the survey. You can see that some of the magenta lines are visible, meaning that the survey positions are not identical to the ideal ones.
Phenix data base and Geant3
There are C libraries to talk to the Phenix SQL data bases, so we
need a Fortran/C interface. Here is what works. We pass the large arrays
via named common blocks (Fortran) and structs (C). Note the 'extern's
and the added underscore in the struct name.
Note how the integer and character arguments are passed.
Routine fvtx_getsurvey.C gets data from table fvtx_survey in the SQL data base.
The Makefile is modified to pick up the C and the data base libraries.
Files (from simulation/pisa2000/src/svx/):
svx_fvtx.f
fvtx_getsurvey.C
Makefile.am
In the Fortran code:

integer version
real xmid(24), ymid(24), wphi(24)        ! declare arrays, and put
common /wedgesurvey/ xmid, ymid, wphi    ! them in a named common

call fvtx_getsurvey(version,disk)        ! call to C, with arguments

----------------------------------------------------
In the C code:

extern "C" {             // This constuction is used
  extern struct {        // to pass variables to/from
    float xmid[24];      // named common block
    float ymid[24];      // common/wedgesurvey/.
    float wphi[24];      //
  } wedgesurvey_ ;       // (name cannot contain underscores)
}                        //

extern "C" void fvtx_getsurvey__(int &ver, char station[3])
{ ...
(C code talking to the data base)
Survey data for the big disks was processed by Steve and Darshana and collected into files Station1_all.csv, Station2_all.csv, Station3_all.csv, and entered into the data base with php script survey_insert_1.php, which is run on rcf2.
The image shows disk SI05 ( = SW St.3), with the ideal and measured silicon
overlayed. There appears to be a systematic rotation between the two,
of order 0.5°,
likely due to the definition of the coordinate system in the measured
data.
The geom.root file that incorporates all this
is here.
After using the new geometry, the residuals dropped significantly for the North Arm, but no effect was seen on the South. (Melynda's plot)
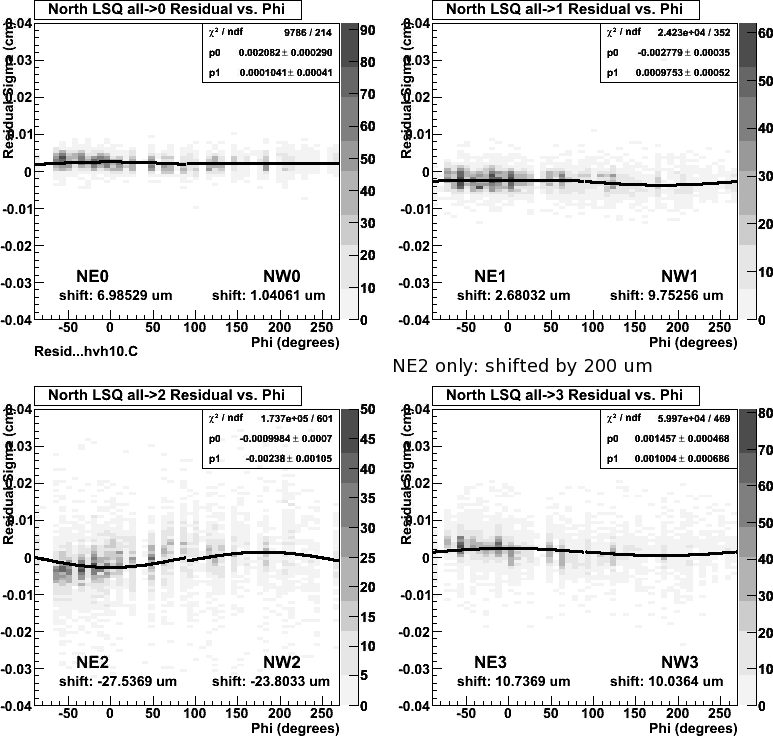
This shows the residuals using only the wedge survey numbers. The fits are to sin(φ), with the phase fixed such that the amplitudes represent shifts in (Phenix global) x. Let's concentrate on the NE quadrant, the left halves of the plots. The biggest shift appears to be for the NE2 disk. If NE2 is indeed shifted by (+or-)154μm, it naturally pulls the fits of the other three stations in the opposite direction, which is what we see. In order to find out the sign of the shift, I do a run with station NE2 only shifted by +200um.
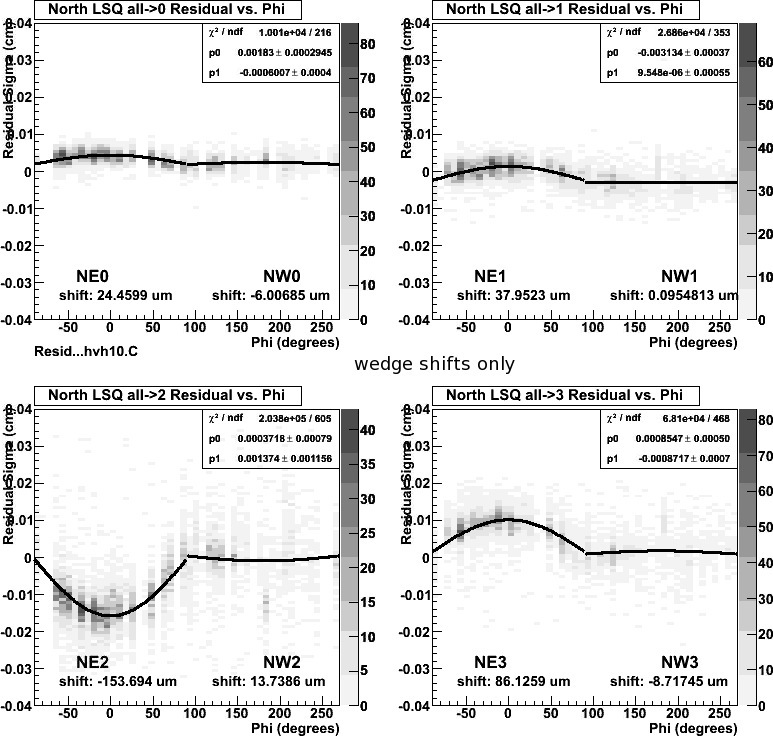
Surprisingly, this seems to correct most of the x-shifts. As for the sign, it is opposite the amplitude (-153), at least for the East disks.
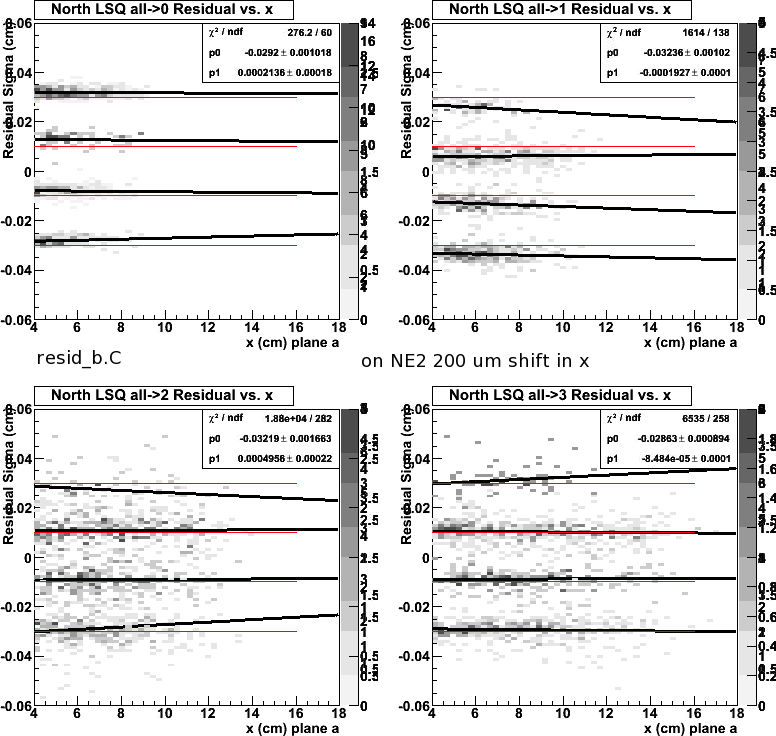
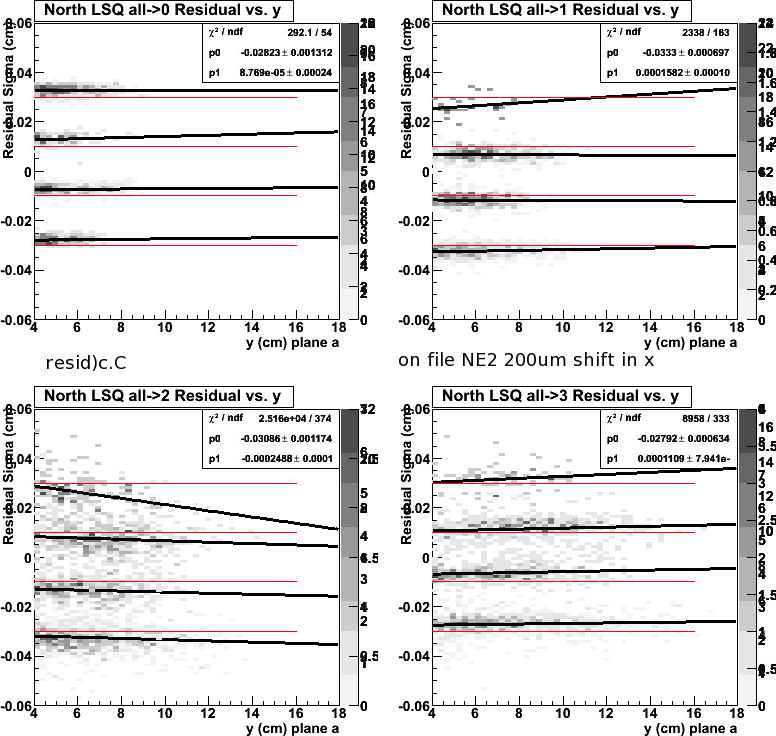
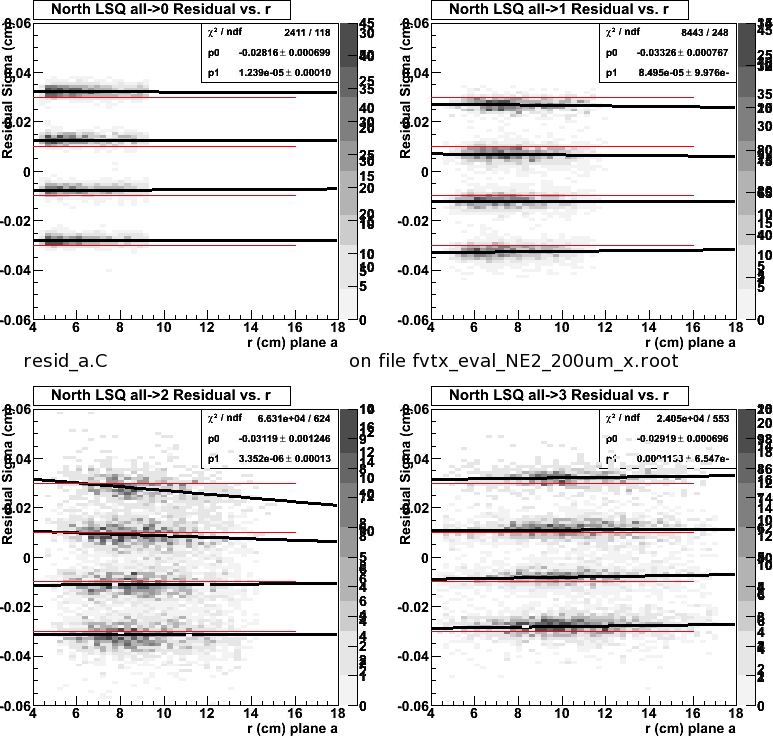
Then, using these results, I looked for tilts of the plane by plotting
the residuals vs. x, y, and r. A slope would indicate a tilt.
Plotted here are residuals vs. x, for North stations 0-3. On each panel I
separated
the measurements for each of the 4 planes (upstream high, upstream low,
downstream low, downstream high), offset by -0.03, -0.01, +0.01, +0.03
respectively, as indicated by the red lines.
The fits (black lines) are independent, though for a given station they should
be the same [should do a joint fit].
No large effects are seen.
Same plots for residuals vs. y, and residuals vs. r.