Station z positions from the December 2011 survey
The files we have from the surveys done in Chemistry are
zipped up here. For each disk, they
look like this (this is file ST0-NW.txt):
DATUM_B -0.000000,  -0.018996,  -7.917148,  0.100707
S0_PIN3,  1.517816,  -7.913124,  -3.675052
S0_PIN2,  3.934753,  -7.921794,  -0.519313
S0_PIN1,  1.509278,  -7.925404,  3.671518
PNT56,    0.361544,  -7.911616,  -3.565323
PNT57,    0.200052,  -7.914775,  -1.599845
PNT58,   -0.223373,  -7.919537,  1.591026
PNT59,   -0.372915,  -7.922602,  3.557912
PT1,  0.708007,  -7.513434,  -3.627784
PT2,  0.328333,  -7.515392,  -1.712858
PT3,  0.753995,  -7.671477,  -1.565260
PT4,  1.610310,  -7.674214,  -3.319559
...
...
PT49, -0.124943,  -8.307491,  1.725705
PT48  -0.257713,  -8.311505,  3.673295
The ones with PIN1,2,3 (A in the figure) and PNT56,7,8,9 (B and C) clearly are points on the disk perimeter, and the 48 that follow are on individual wedges. Points A correspond to precision holes drilled to accept survey pins. These pins were designed to protrude from the cage, and a survey mark would then be visible to the telescope-based survey system that was in use at the time of the FVTX design. However, by 2011, this system was replaced by a touch-based machine, which could reach through the cage openings and touch the precision holes themselves, so the survey pins were no longer used. Points B correspond to threaded holes where the transfer fixture connects. Points C are somewhere on the surface of the disk edge, but there is no well-defined place in z or y where this would be. On the right is an x-y plot of the 7 points on the disk (red), with a representation of a disk superimposed. | 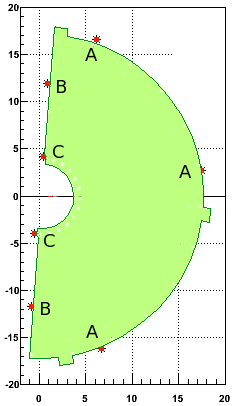
| |||||||||||||||||||||||||||||||||||||||||||||||||||||||||||||||
Take the average of the 7 points for each disk, and compare them with the design values:
                                                                   cage     local
   station    measured       ->cm         design   delta(cm)  ->μm  mean    delta
   ------------------------------------------------------------------------------
   ST0-NW    -7.91840000   -20.11273600   -20.11   -0.00273    -27   -251    224
   ST1-NW   -10.29898014   -26.15940956   -26.14   -0.01940   -194            57
   ST2-NW   -12.69863229   -32.25452602   -32.17   -0.08452   -845          -594
   ST3-NW   -15.02977714   -38.17563394   -38.20    0.02436    244           495

   ST0-SW     7.91670542    20.10843179    20.11   -0.00156    -16    133   -149
   ST1-SW    10.31122814    26.19051948    26.14    0.05051    505           372
   ST2-SW    12.66787614    32.17640540    32.17    0.00640     64           -69
   ST3-SW    15.03856514    38.19795546    38.20   -0.00204    -20          -153

   ST0-NE    -7.91313314   -20.09935818   -20.11    0.01064    106    -48    154
   ST1-NE   -10.29569529   -26.15106604   -26.14   -0.01106   -111           -63
   ST2-NE   -12.67112986   -32.18466984   -32.17   -0.01466   -147           -99
   ST3-NE   -15.04074014   -38.20347996   -38.20   -0.00347    -35            13

   ST0-SE     7.92572857    20.13135057    20.11    0.02135    214    306    -92
   ST1-SE    10.30396786    26.17207836    26.14    0.03207    321            15
   ST2-SE    12.70120057    32.26104945    32.17    0.09104    910           604
   ST3-SE    15.04272414    38.20851932    38.20    0.00851     85          -221
The 'local delta' is the difference in each cage between the cage average and the
disk delta. This would show if for example disk3 is always shifted in the same way
in each cage. No such systematic pattern is seen.
| ||||||||||||||||||||||||||||||||||||||||||||||||||||||||||||||||
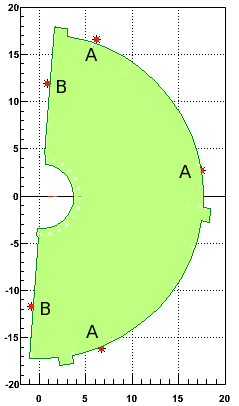
Deviations are large, some almost 1mm. The 4 holes along the straight edge are threaded screw holes for the transfer fixture. The 3 on the perimeter are precision holes. Using only those 3 points, the deviations are:
                                                          cage local
   station  measured      ->cm        design  delta(μm)   mean delta
   -----------------------------------------------------------------
   ST0-NW  -7.920107    -20.11707    -20.11     -71      -224   153
   ST1-NW -10.302855    -26.16925    -26.14    -293             -69
   ST2-NW -12.686931    -32.22480    -32.17    -548            -324
   ST3-NW -15.038646    -38.19816    -38.20      18             242

   ST0-SW   7.919842     20.11639     20.11      64       272  -208
   ST1-SW  10.313671     26.19672     26.14     567             295
   ST2-SW  12.674349     32.19284     32.17     228             -44
   ST3-SW  15.048441     38.22304     38.20     230             -42

   ST0-NE  -7.928107    -20.13739    -20.11    -274      -589   315
   ST1-NE -10.319777    -26.21223    -26.14    -722            -133
   ST2_NE -12.692989    -32.24019    -32.17    -702            -113
   ST3-NE -15.065276    -38.26580    -38.20    -658             -69

   ST0-SE   7.925278     20.13020     20.11     202      367   -165
   ST1-SE  10.306207     26.17776     26.14     378              11
   ST2-SE  12.690118     32.23289     32.17     629             262
   ST3-SE  15.049515     38.22576     38.20     258            -109
| 
| |||||||||||||||||||||||||||||||||||||||||||||||||||||||||||||||
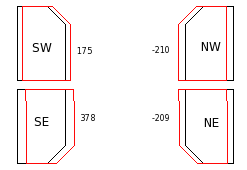
Same exercise, but now only omitting the ill-defined 'C' points:
                                               cage  local
   station  measured   ->cm   design   delta(um)  mean  delta
   -----------------------------------------------------------
   ST0-NW    -7.9189   -20.11402    -20.11    -40  -210  170
   ST1-NW    -10.300   -26.16231    -26.14   -223        -13
   ST2-NW    -12.695   -32.24561    -32.17   -756       -546
   ST3-NW    -15.032   -38.18238    -38.20    176        386

   ST0-SW     7.9176    20.11081     20.11      8   175 -167
   ST1-SW     10.311    26.19243     26.14    524        349
   ST2-SW     12.669    32.18134     32.17    113        -62
   ST3-SW     15.041    38.20548     38.20     55       -120

   ST0-NE    -7.9176   -20.11078    -20.11     -9  -209  200
   ST1-NE    -10.302   -26.16940    -26.14   -294        -85
   ST2-NE    -12.677   -32.20133    -32.17   -313       -104
   ST3-NE    -15.048   -38.22214    -38.20   -221        -12

   ST0-SE     7.9255    20.13097     20.11    210  378  -168
   ST1-SE     10.304    26.17378     26.14    338        -40
   ST2-SE     12.697    32.25260     32.17    826        448
   ST3-SE     15.044    38.21369     38.20    137       -241
| 
| |||||||||||||||||||||||||||||||||||||||||||||||||||||||||||||||
Note some of these measurements were done during the "pre-survey', which is the stage before integration into the master frame with the VTX (pictures here). The cages are then still in the assembly frame. The reason is that the survey points (the 3 precision holes where the survey pins would have gone) can be reached through openings in the cage only before the integration with the VTX (see this page for the survey pins). From this pre-survey the only values that are significant are the relative placements of the disks inside a cage.  The drawing shows the survey pins sticking out of the cage. In the drawing, the pins for station 3 are
obscured by the cooling plate.
The drawing shows the survey pins sticking out of the cage. In the drawing, the pins for station 3 are
obscured by the cooling plate.
No other surveys were done to fix the station z positions. | 
| |||||||||||||||||||||||||||||||||||||||||||||||||||||||||||||||
Using the relative z positions of the disks (red numbers in the table above), the alignment software gives these results: 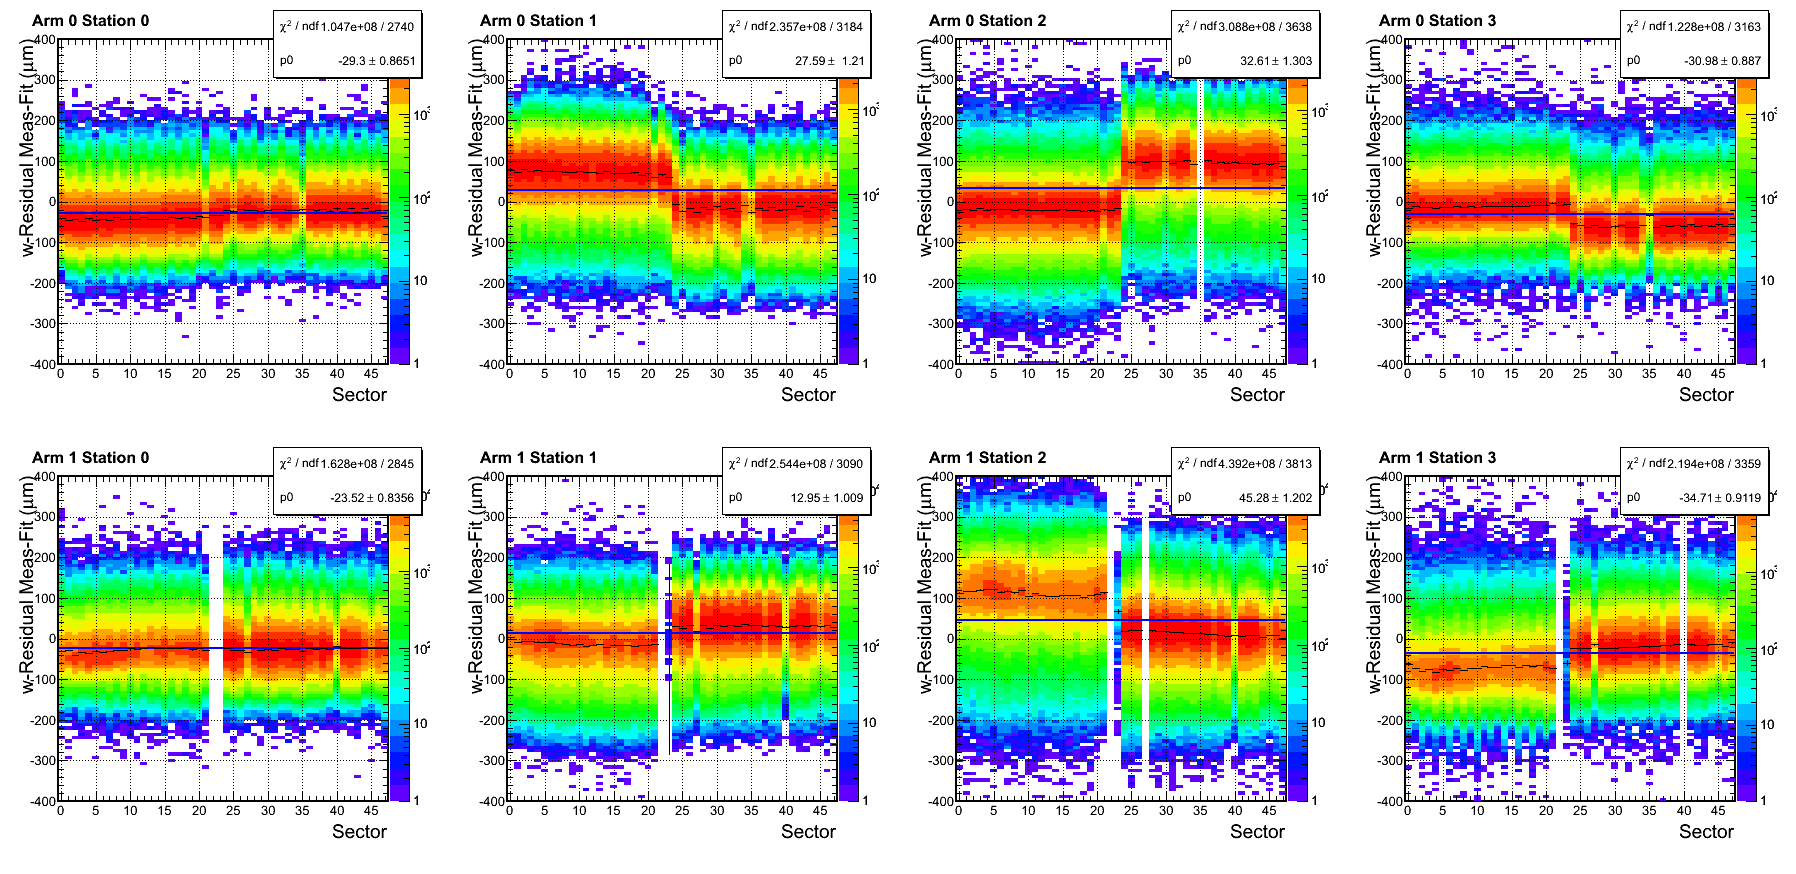
The parallel shifts of blocks of residues shows a uniform growth in r, which is unphysical, but can also be caused by a bad placement in z. So the z survey numbers we have appear not to be usable. | ||||||||||||||||||||||||||||||||||||||||||||||||||||||||||||||||
| In November 2013 a survey was done to determine the z-positions of the half-disk, after integration with the VTX. Since the precision points are buried, the measurements were done by touching the upstream and downstream surfaces of the disks, where they are exposed near the center plane. In some cases, also a disk surface was reachable near the mounting tabs. The reference system was derived from fixed points on the master frame and support structure, which are fixed from year to year.
There appears to be one outlier, SW3, and the N and S cages appear to be abour 200μm closer together than the design distance. | 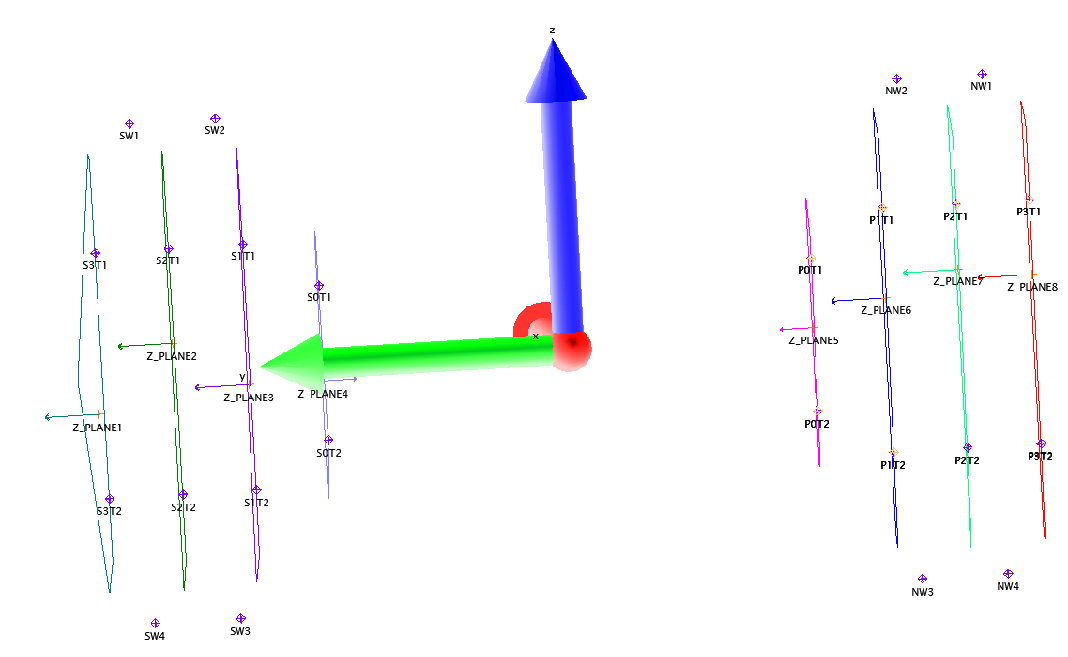

| |||||||||||||||||||||||||||||||||||||||||||||||||||||||||||||||
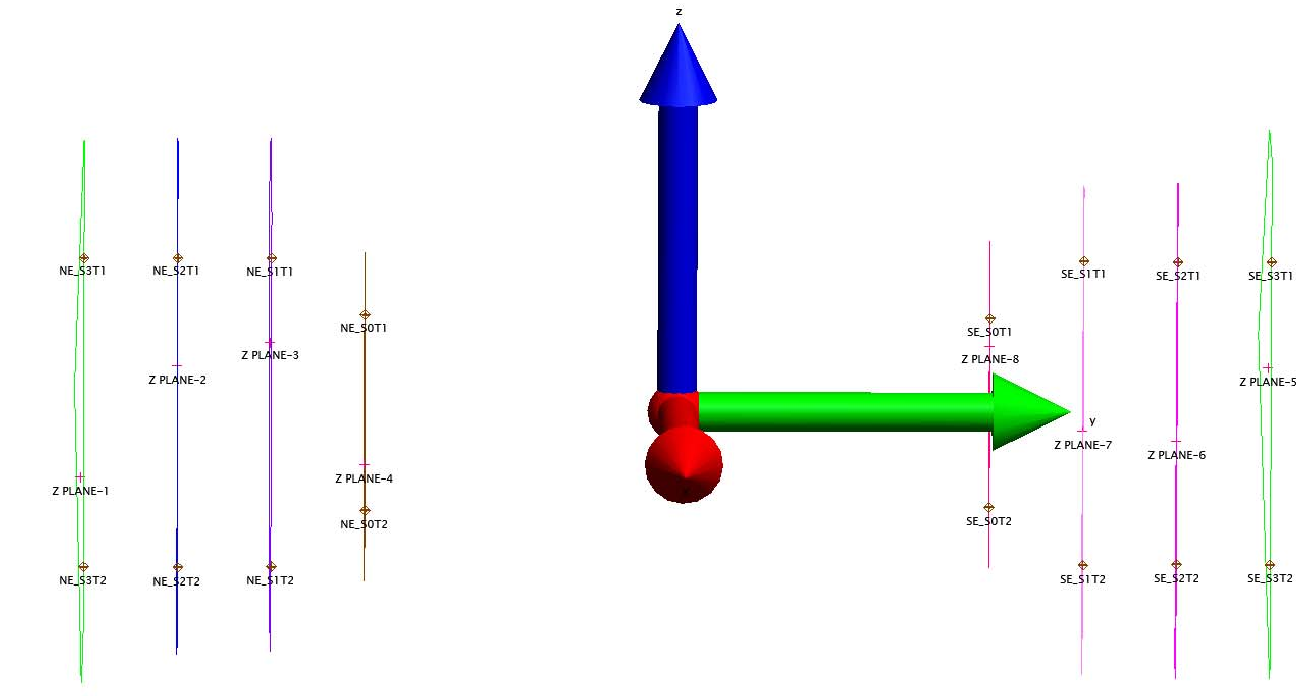
Same for the East half:
| 

|
|||||||||||||||||||||||||||||||||||||||||||||||||||||||||||||||
Hubert Van Hecke Last modified: Fri Nov 22 15:58:26 MST 2013